


GBP/USD 5-Minute Chart Analysis
On Tuesday, the GBP/USD currency pair remained under pressure, despite the fact that the political crisis in France has no direct connection to the UK. In recent days, the British pound has been clearly trading within a classic flat range, observable on both the hourly and daily timeframes. So, these abrupt upward and downward moves are not surprising.
Ideally, we prefer to see the dollar decline and the pound rise, as most fundamental and macroeconomic indicators still support this scenario. However, over the past several months, the market has consistently demonstrated an unwillingness to sell the dollar aggressively. It's also possible that central banks may have started interventions aimed at suppressing the growth of European currencies — a possibility we can't rule out.
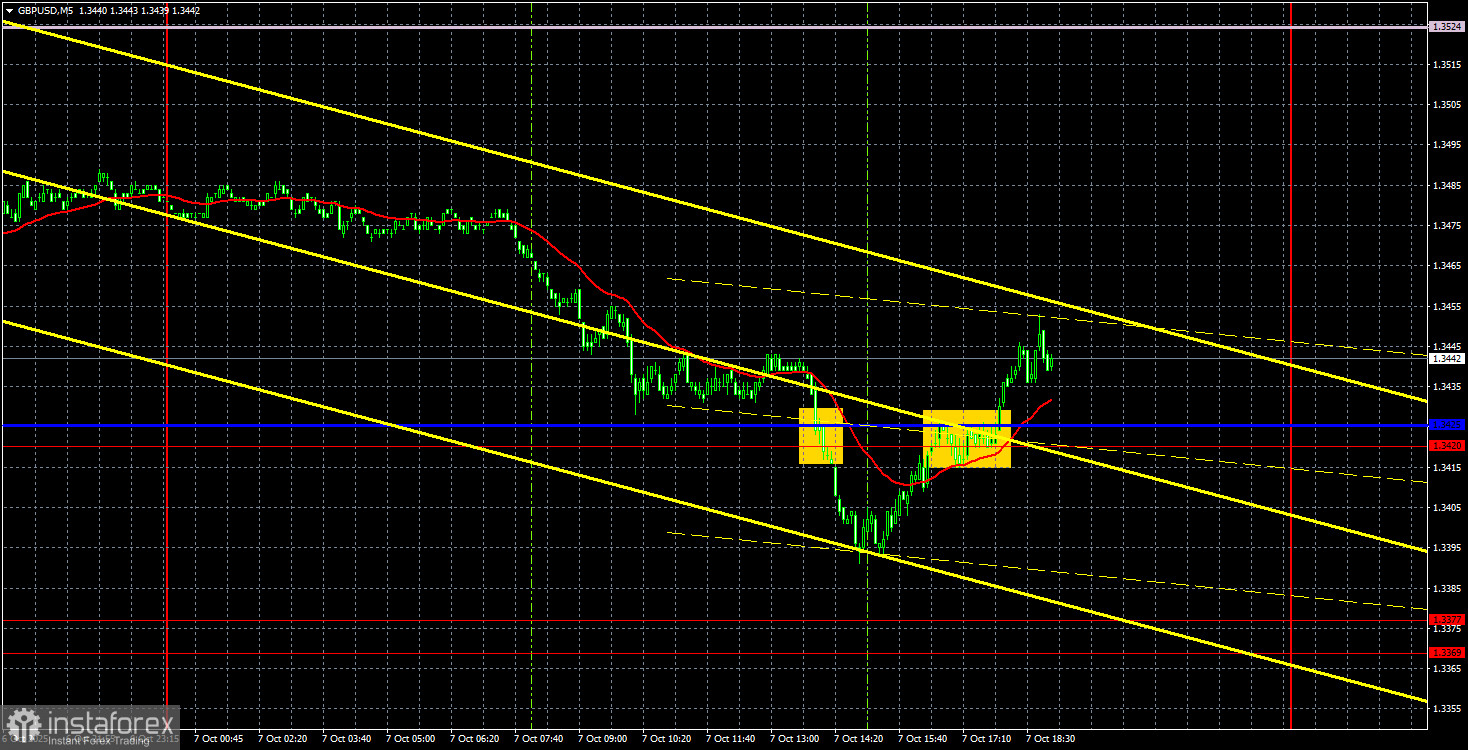
From a technical standpoint, flat trading conditions are always troublesome for traders. If a flat range has clearly defined channel boundaries that the price consistently respects, then it's still possible to trade from level to level. But currently, no such clear boundaries exist. Yesterday, the pair broke through the 1.3420 level, which had previously acted as a ceiling, only to rebound back upward almost immediately. It was a false breakout. Overall, the current price action is not ideal for trading.
On the 5-minute timeframe, two trading signals were generated. First, the pair broke below the 1.3420–1.3425 zone, but the subsequent drop was short-lived. Then, it consolidated back above the area, but the upward movement didn't last long either. In both cases, the price barely managed to move 20 pips in the intended direction. Volatility remains mediocre, as does the overall character of price action in the pair.
Commitment of Traders (COT) Report
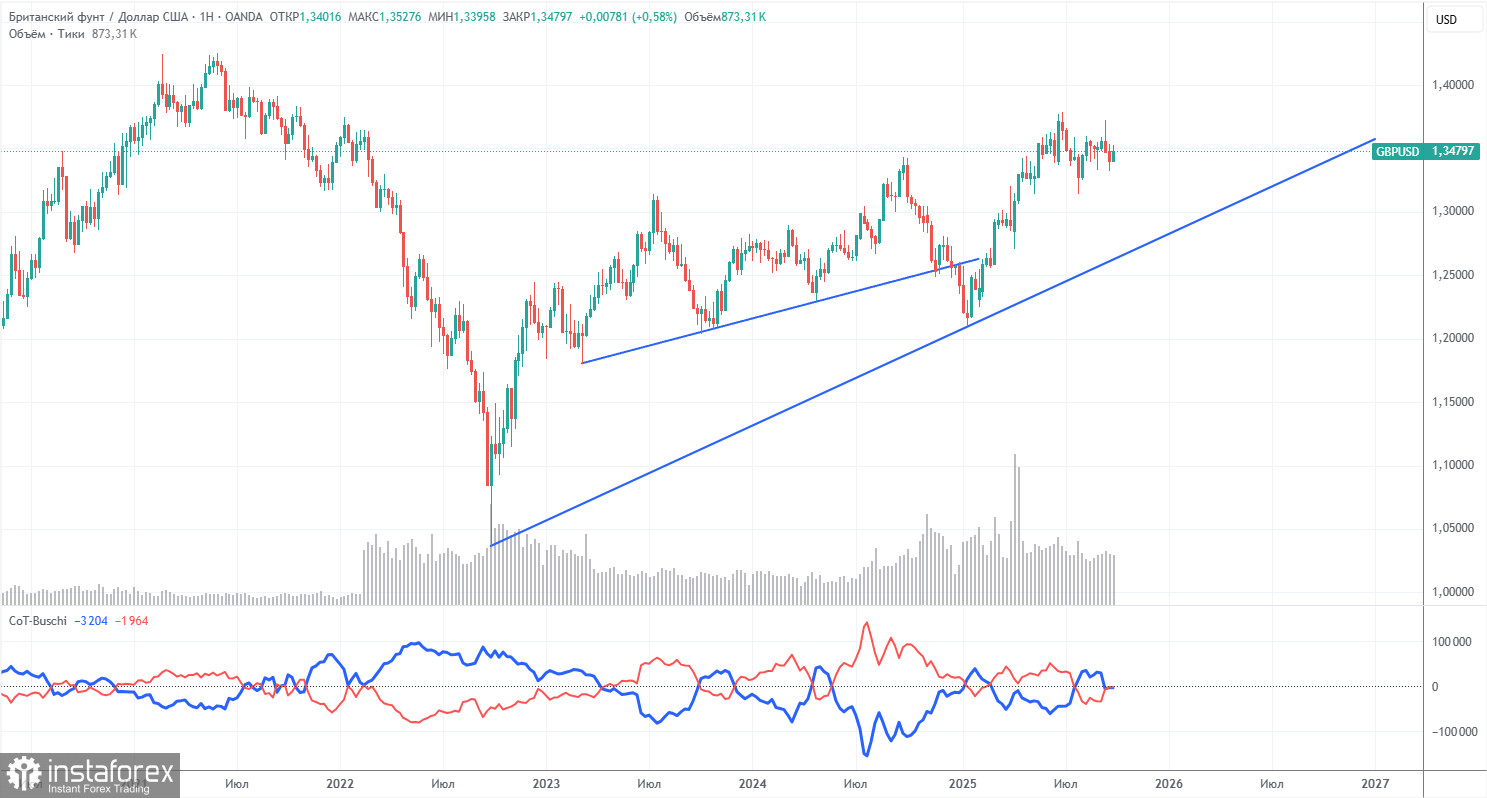
COT reports for the British pound indicate that commercial trader sentiment has been fluctuating in recent years. The red and blue lines — representing the net positions of commercial and non-commercial traders — tend to intersect frequently and hover near the zero mark. Currently, they are almost at the same level, which reflects an approximately even number of long and short positions.
The U.S. dollar continues to weaken due to the policies of Donald Trump. As such, current demand for the pound among large market participants is no longer a decisive factor. The trade war is expected to persist in one form or another for some time. Meanwhile, the Federal Reserve is likely to continue cutting interest rates over the coming year, which will likely further weaken the dollar in any case.
According to the latest pound-related COT report, the "Non-commercial" group opened 3,700 new buy contracts while closing 900 sell contracts, resulting in a weekly increase in net long positions by 4,600 contracts.
The British pound experienced significant gains in 2025, primarily due to the Trump administration's aggressive economic policies. Once this factor is removed, the dollar could resume an upward trajectory — but the timing remains impossible to predict. Whether net positioning for the pound is rising or falling is almost irrelevant at this point, as the dollar's positioning is declining faster either way.
GBP/USD 1-Hour Chart Analysis
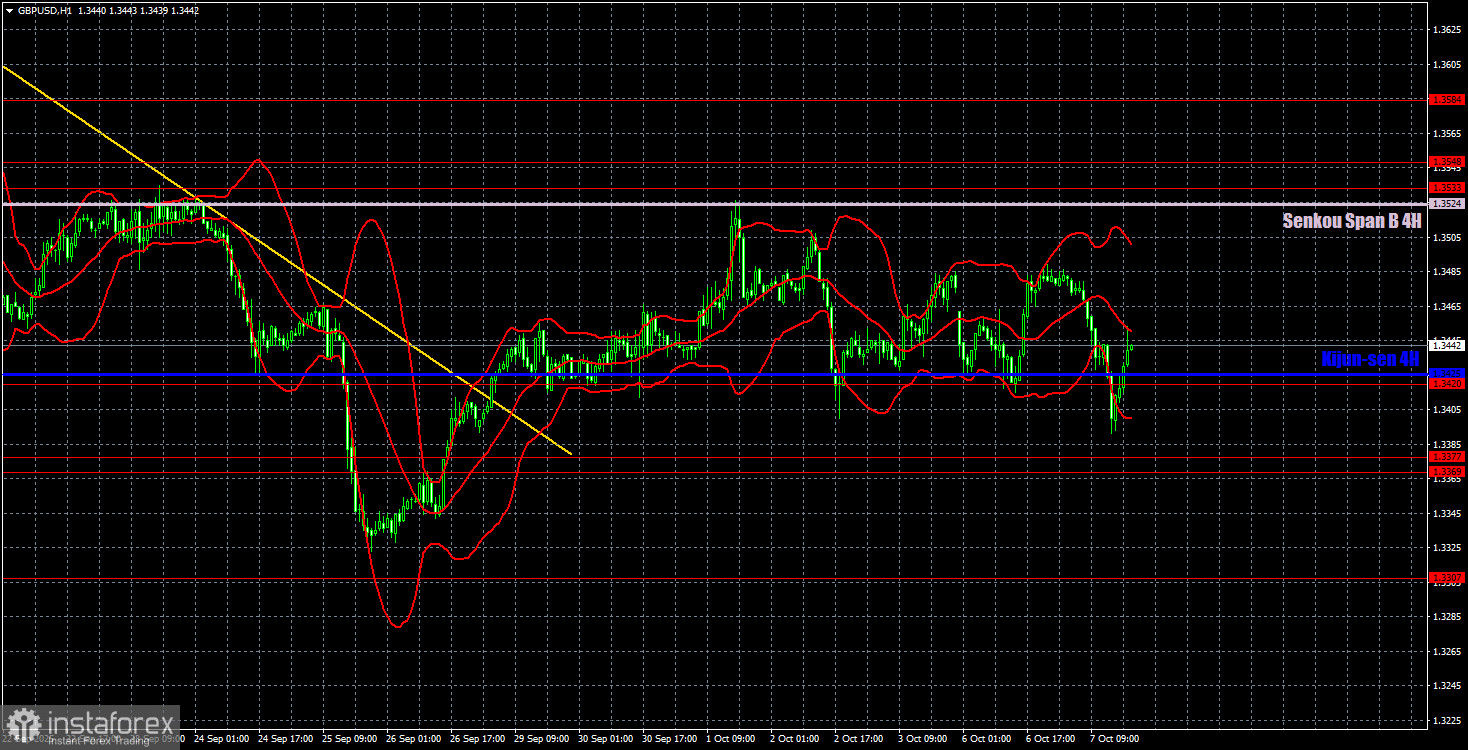
On the hourly chart, GBP/USD continues to maintain its new upward trend. The trendline has been broken, so traders are justified in expecting the pair to continue moving higher. The dollar still lacks significant bullish catalysts, so we foresee a continuation of the 2025 uptrend under most scenarios. Last week, the pair bounced from a significant support at the Senkou Span B line, which triggered a correction. Since then, it has bounced off the key Kijun-sen line three times — confirming its technical strength.
For October 8, we highlight the following important levels: 1.3125, 1.3212, 1.3369–1.3377, 1.3420, 1.3533–1.3548, 1.3584, 1.3681, 1.3763, 1.3833, and 1.3886. The Senkou Span B line at 1.3524 and the Kijun-sen line at 1.3425 can also act as potential sources of signals. Traders are advised to move Stop Loss orders to breakeven once the price moves 20 pips in the intended direction. Ichimoku indicator lines may shift throughout the day, which should be taken into account when identifying support, resistance, or trend confirmations.
On Wednesday, no market-moving economic events are scheduled in either the UK or the U.S. As a result, traders will once again have little to react to. The FOMC minutes, which will be released in the evening, are widely regarded as a formal document and are unlikely to shift sentiment significantly.
Trading Recommendations
On Wednesday, traders may once again trade from the 1.3420–1.3425 area. However, bear in mind that the current volatility and trend structure are far from ideal. A flat range has clearly formed on both the hourly and daily timeframes.
Chart Notes
Support and resistance price levels — thick red lines where price movements may end. These are not used as signal generators.
Kijun-sen and Senkou Span B — Ichimoku indicator lines, transferred from the 4-hour timeframe to the hourly chart. These are considered strong reference lines.
Extreme levels — thin red lines marking areas where the price has previously bounced. These can act as signal areas.
Yellow lines — trendlines, trend channels, and other technical patterns.
COT Chart Indicator 1 — shows the net positions held by different categories of traders.


