


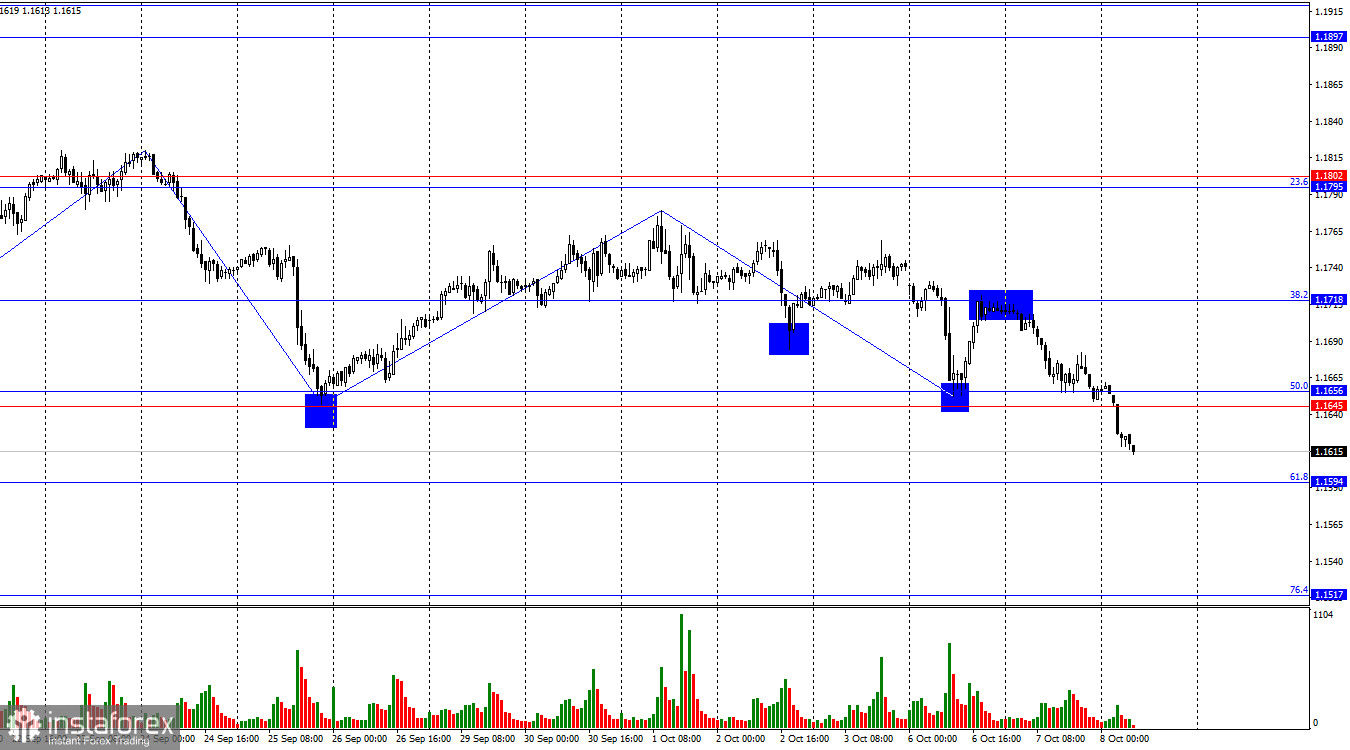
On Tuesday, the EUR/USD pair rebounded from the 38.2% retracement level at 1.1718 on the new Fibonacci grid, reversed in favor of the US dollar, and fell, consolidating below the support zone of 1.1645–1.1656. Thus, the decline may continue on Wednesday toward the next Fibonacci level of 61.8% at 1.1594. A rebound of the pair's rate from this level or a close above the 1.1645–1.1656 level would work in favor of the euro and some growth. Consolidation below the 1.1594 level will increase the likelihood of a continued decline toward the next retracement level of 76.4% at 1.1517.
The wave situation on the hourly chart remains simple and clear. The last completed upward wave did not break the peak of the previous wave, while the new downward wave broke the previous low. Thus, the trend remains "bearish" at this time. The latest labor market data and the changed outlook for the Fed's monetary policy support the bulls, so I expect the trend to change to "bullish." For the "bearish" trend to end, the price needs to consolidate above the last peak – 1.1779.
On Tuesday, the news background was once again virtually absent. Christine Lagarde's new speech did not provide any fresh insights, as the ECB president mostly spoke about frozen assets and loans to Ukraine. Meanwhile, the "shutdown" in the United States continues. Democrats and Republicans made another attempt not to negotiate, but to pass a budget bill through a Senate vote. The attempt failed, just like all the previous ones. I don't understand the point of such votes if the parties are not willing to compromise. However, the dollar itself, which should have been under market pressure due to the shutdown, is feeling just fine and shows no problems. For the first time in a long while, amid negative news, the US currency is rising. The chart still indicates a "bearish" trend, so at the very least, we need to wait for its completion before trading on the news.
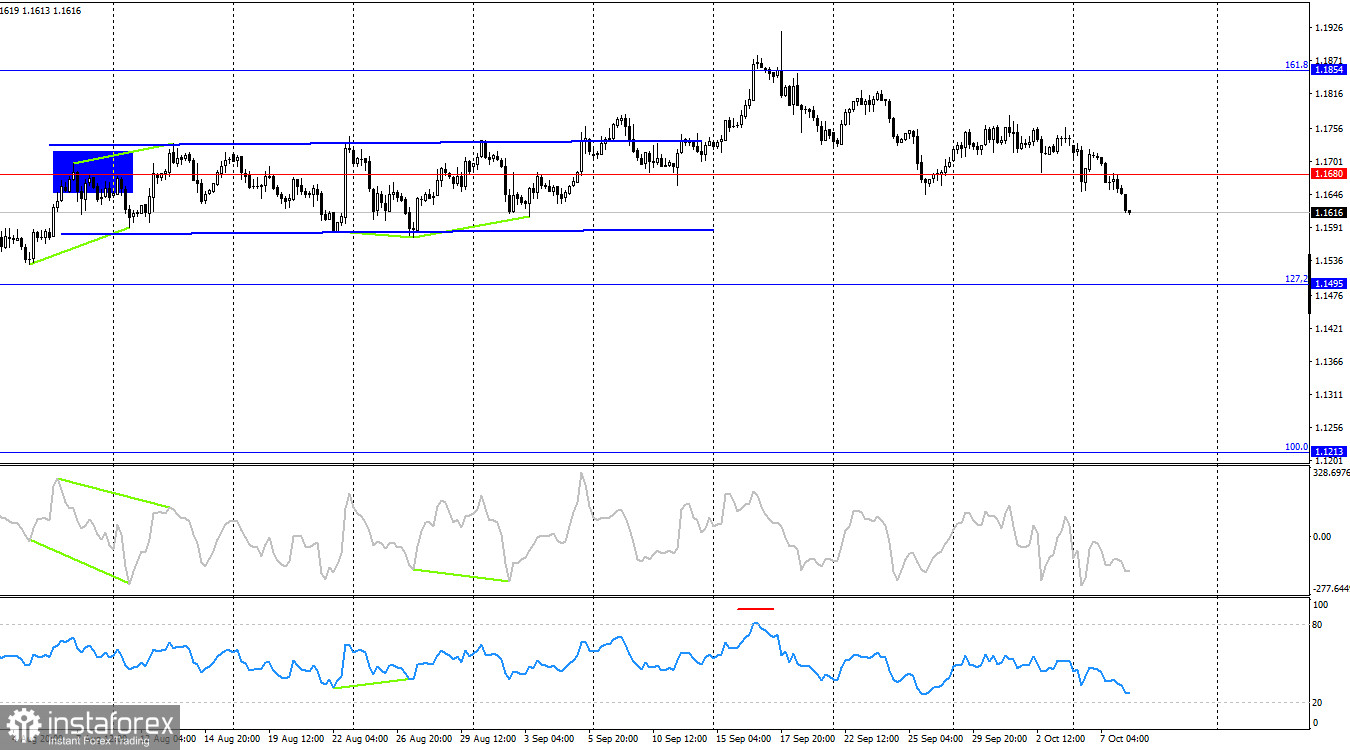
On the 4-hour chart, the pair consolidated below the 1.1680 level, which allows traders to expect a continuation of the decline toward the 127.2% retracement level at 1.1495. No emerging divergences are seen today on any indicator. A close of the pair's rate above 1.1680 would work in favor of the euro and a resumption of the "bullish" trend toward the 161.8% retracement level at 1.1854.
Commitments of Traders (COT) Report:
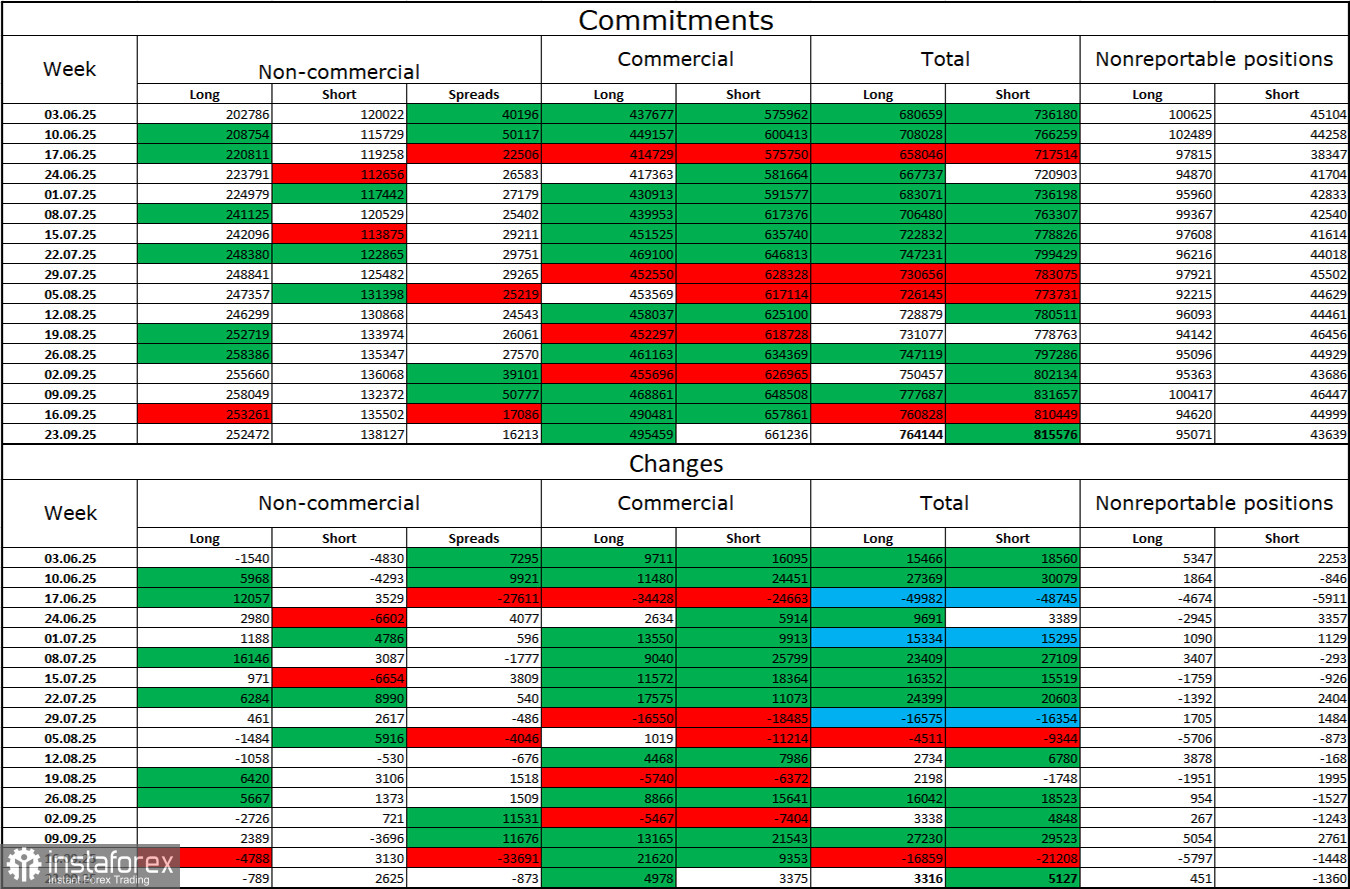
During the latest reporting week, professional players closed 789 Long positions and opened 2,625 Short positions. The sentiment of the "Non-commercial" group remains "bullish" thanks to Donald Trump and is strengthening over time. The total number of Long positions held by speculators now stands at 252,000, while Short positions number 138,000. The gap is almost twofold. In addition, note the number of green cells in the table above. They show a strong buildup of positions in the euro. In most cases, interest in the euro is only increasing, while interest in the dollar is decreasing.
For thirty-three weeks in a row, large players have been reducing their Short positions and increasing Long positions. Donald Trump's policies remain the most significant factor for traders, as they could trigger many problems of a long-term and structural nature for America. Despite the signing of several important trade agreements, many key economic indicators continue to show a decline.
News calendar for the US and the Eurozone:
- Eurozone – Change in industrial production in Germany (06:00 UTC).
- Eurozone – Speech by ECB President Christine Lagarde (16:00 UTC).
- USA – FOMC meeting minutes (18:00 UTC).
On October 8, the economic calendar contains three entries, none of which I consider important. The influence of the news background on market sentiment on Wednesday may be present but weak.
EUR/USD forecast and trader advice:
Sales were possible on the rebound from the 1.1718 level on the hourly chart. The support level of 1.1645–1.1656 has been broken, so short positions can be held with the target of 1.1594. Purchases can be considered on a rebound from the 1.1594 level or on a close above the 1.1645–1.1656 zone.
The Fibonacci grids are built on 1.1392–1.1919 on the hourly chart and on 1.1214–1.0179 on the 4-hour chart.


