


Trend Analysis (Fig. 1).
On Thursday, from the level of 1.1628 (yesterday's daily candle close), the market may continue moving downward with a target at 1.1592 – the 61.8% retracement level (blue dashed line). When testing this level, the price may bounce upward with a target at 1.1608 – a historical resistance level (light blue dashed line).
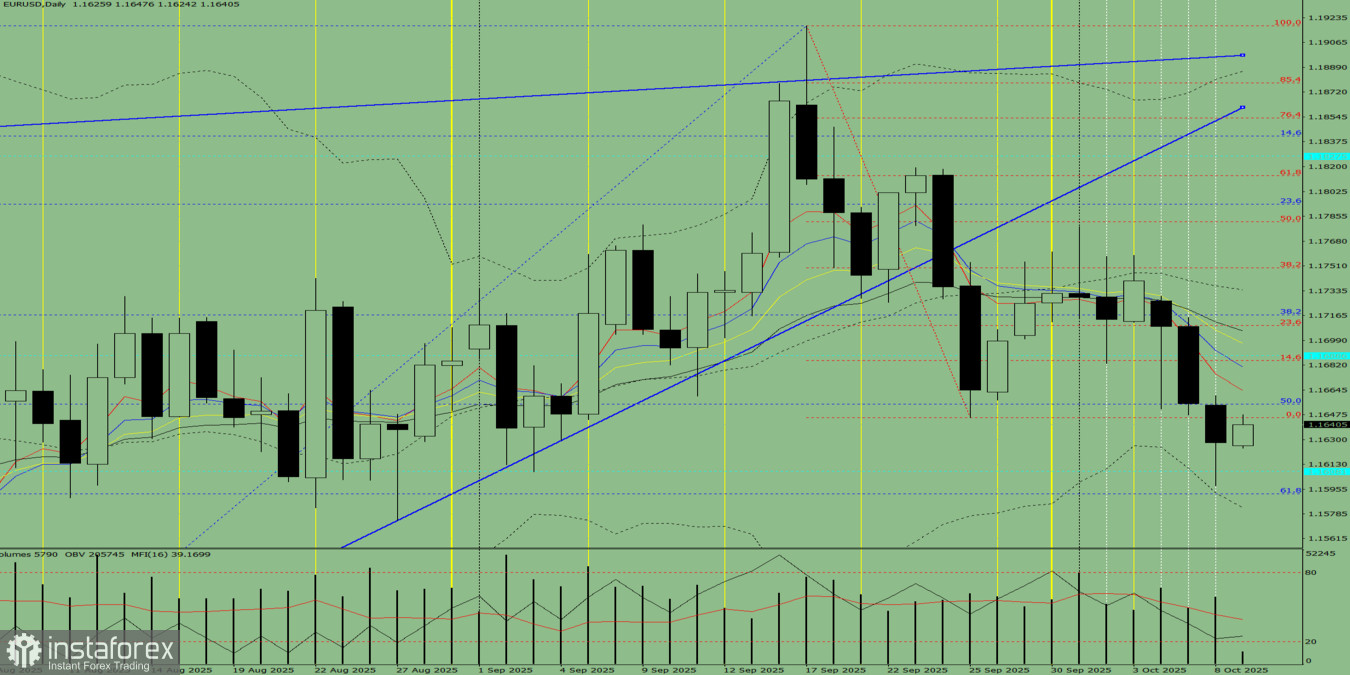
Fig. 1 (Daily Chart).
Comprehensive Analysis:
- Indicator analysis – downward;
- Fibonacci levels – downward;
- Volumes – downward;
- Candlestick analysis – downward;
- Trend analysis – downward;
- Bollinger Bands – downward;
- Weekly chart – downward.
Overall conclusion: Downward trend.
Alternative scenario: On Thursday, from the level of 1.1628 (yesterday's daily candle close), the market may continue moving downward with a target at 1.1608 – a historical resistance level (light blue dashed line). When testing this level, the price may bounce upward with a target at 1.1645 – the lower fractal (red dashed line).


