


Trend Analysis
This week, from the level of 1.3355 (the closing price of the last weekly candle), the price may continue to move downward, targeting 1.3141 — the 38.2% retracement level (red dashed line). Upon testing this level, the price may rebound upward toward 1.3270 — the historical support level (light blue dashed line).
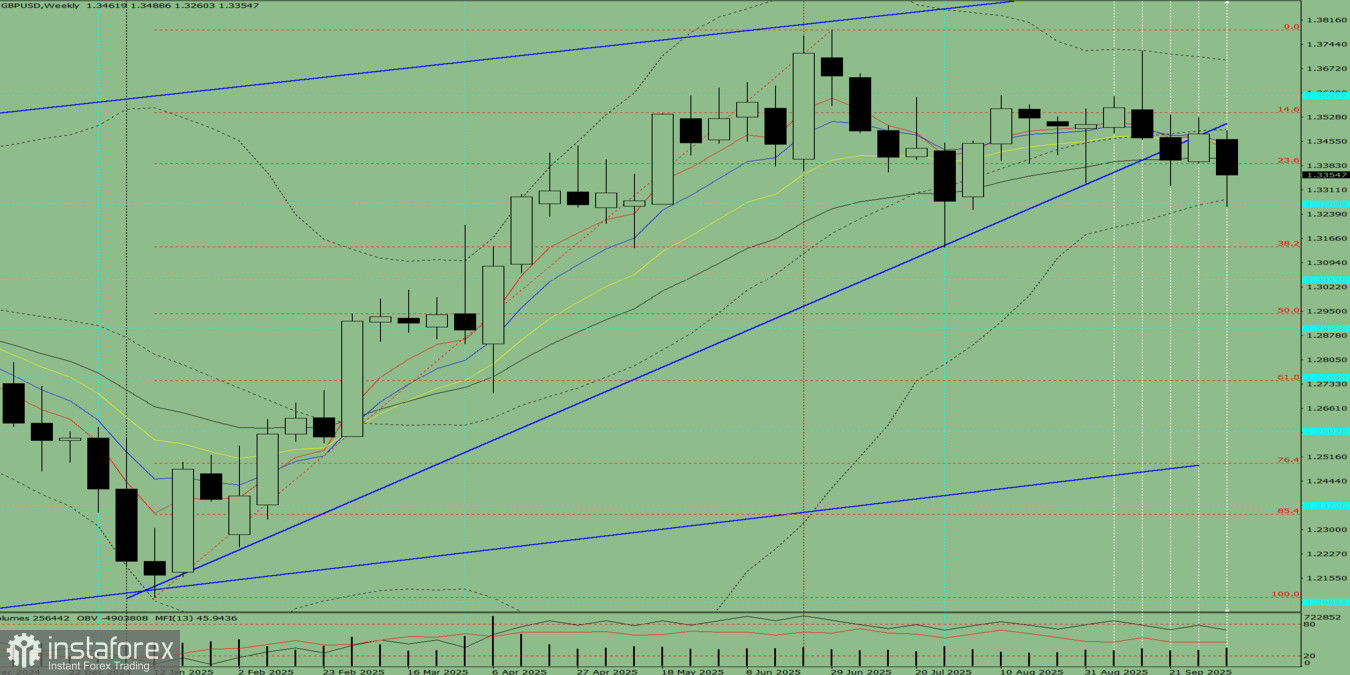
Figure 1: Weekly Chart
Comprehensive Analysis
- Indicator analysis – downward;
- Fibonacci levels – downward;
- Volumes – downward;
- Candlestick analysis – downward;
- Trend analysis – downward;
- Bollinger Bands – downward;
- Monthly chart – downward.
Overall Conclusion
Based on the weekly chart, the GBP/USD pair is most likely to show a downward trend during the week, with no upper shadow on the weekly black (bearish) candle (Monday — down) and the presence of a lower shadow by Friday (Friday — up).
Alternative Scenario
From the level of 1.3355 (closing price of the last weekly candle), the price may continue to move downward toward 1.3044 — a historical support level (light blue dashed line). Upon reaching this level, the price may start moving upward, targeting 1.3141 — the 38.2% retracement level (red dashed line).


