


EUR/USD 5-Minute Chart Analysis
On Wednesday, the EUR/USD pair once again traded in a very lackluster fashion. The only notable event of the day was the Eurozone industrial production report, which—although still weak—came in slightly better than the most pessimistic market forecasts. As a result, the euro experienced a modest uptick. However, overall, we saw yet another day of extremely low volatility. In recent sessions, price action resembles a flat movement on both intraday and daily timeframes. It almost feels as though U.S. traders, along with government institutions shut down by the ongoing budget deadlock, have simply gone on vacation.
Technically, the most recent downtrend has been invalidated, as the trendline has been broken. Even in the short term, EUR/USD continues to show technical potential for further gains. The Kijun-sen line has also been breached, suggesting a move toward the Senkou Span B line. At present, however, the Senkou Span B is advancing rapidly and may soon meet the price.
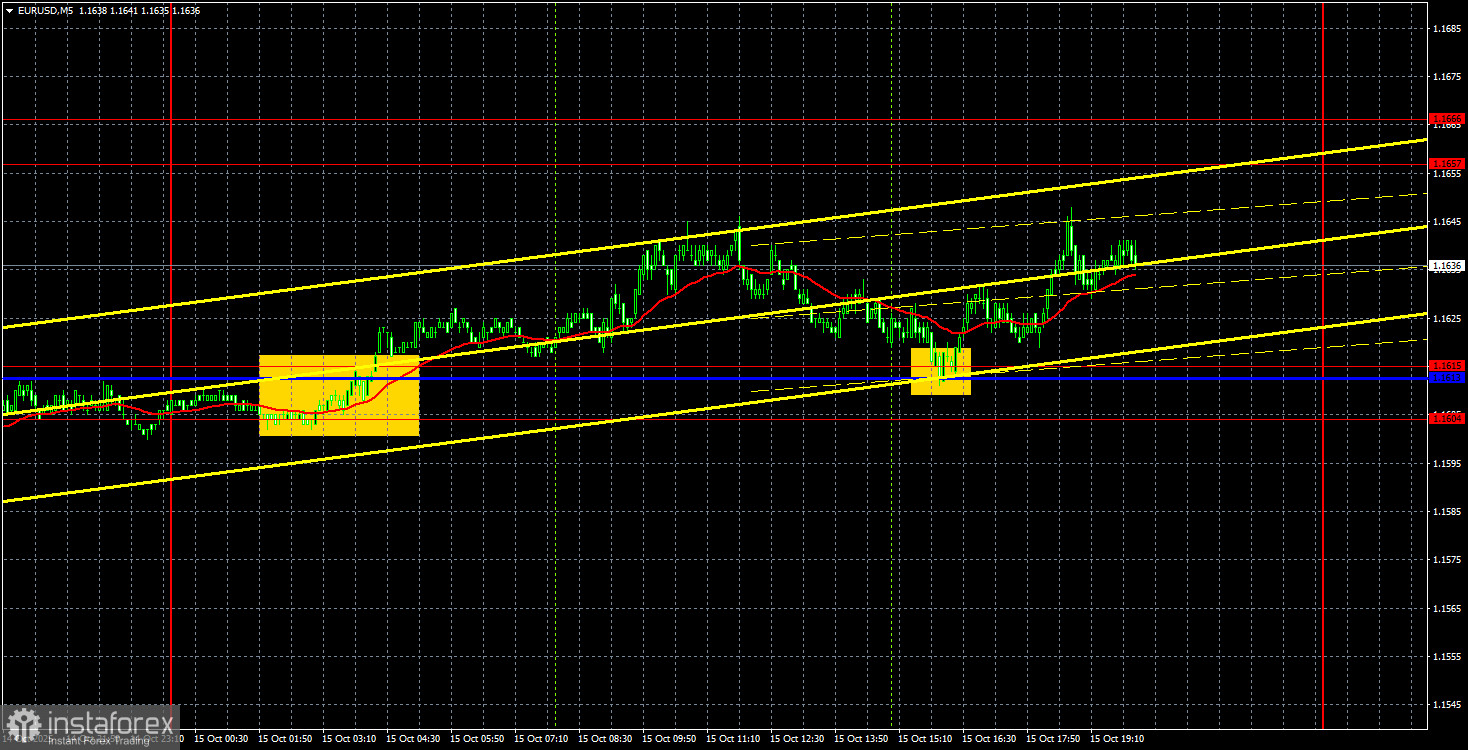
On the 5-minute chart, two signals were generated on Wednesday. The first came overnight with a breakout above the 1.1604–1.1615 range, and the second came during the U.S. trading session with a bounce from that same zone. In both cases, the upward movement was modest—only 10 to 20 pips—making it difficult to extract meaningful profits in such low-volatility conditions.
Commitments of Traders (COT) Report
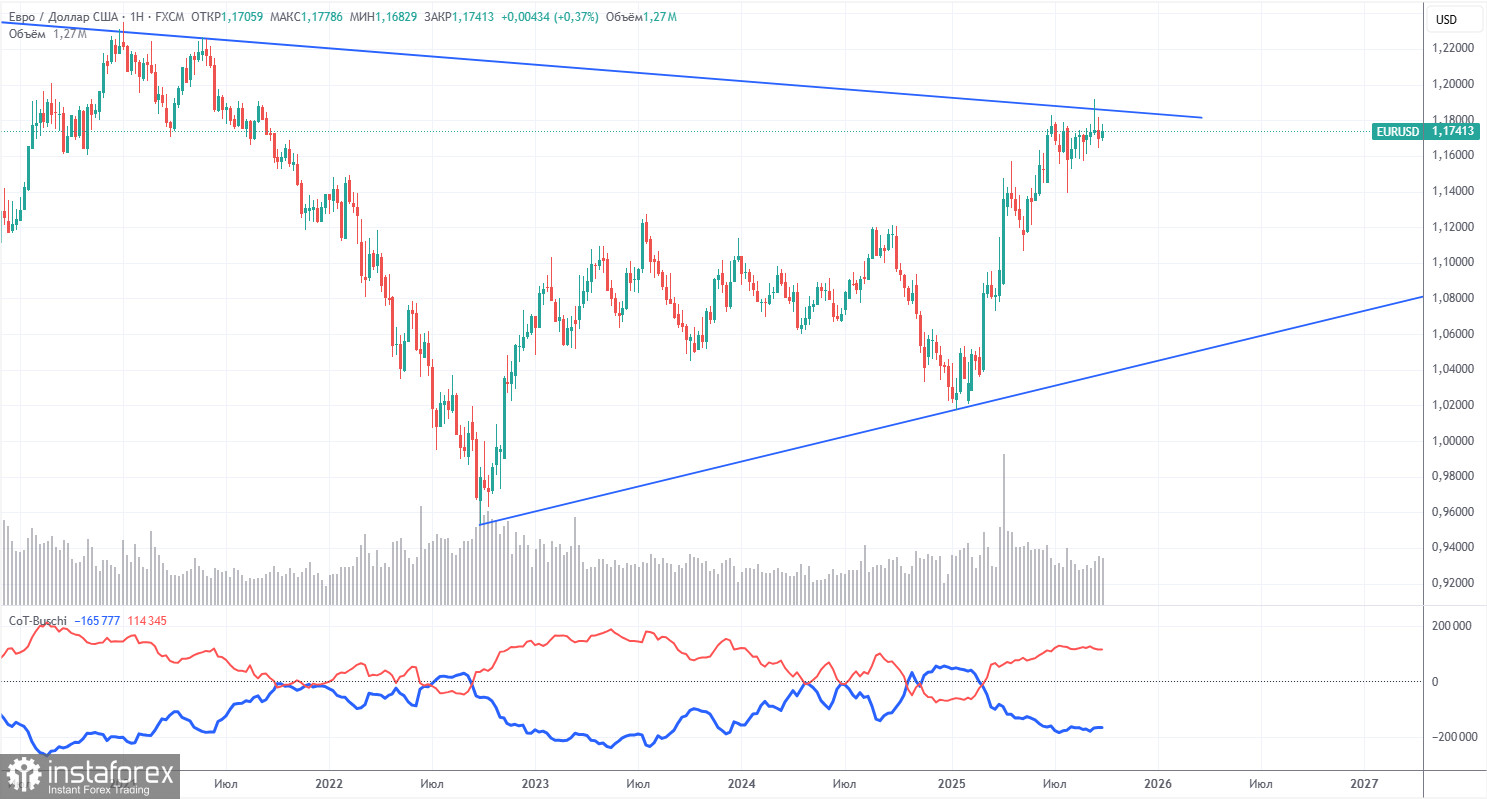
The latest COT report is dated September 23. As shown in the accompanying illustration, non-commercial traders (major market participants) have maintained a net long position in the euro for some time. Bears barely gained control at the end of 2024, only to lose it quickly. Since Donald Trump returned to the presidency, only the U.S. dollar has declined in value.
Although we can't say with certainty that the dollar's drop will continue, current global developments suggest this is the likely scenario. There are still very few fundamental reasons to support the U.S. currency, while many downside factors remain. While the long-term downtrend in EUR/USD is not fully broken, the past 17 years of historical movement matter less now. Once Trump ends his trade wars—if he ever does—the dollar might recover. But recent events suggest the conflict will persist. Additionally, there's the rising risk of the Federal Reserve losing its independence, which could further undermine dollar strength.
During the latest reporting week, non-commercial long positions decreased by 800 contracts, while shorts increased by 2,600. As a result, the net position declined by 3,400 contracts.
EUR/USD 1-Hour Chart Analysis
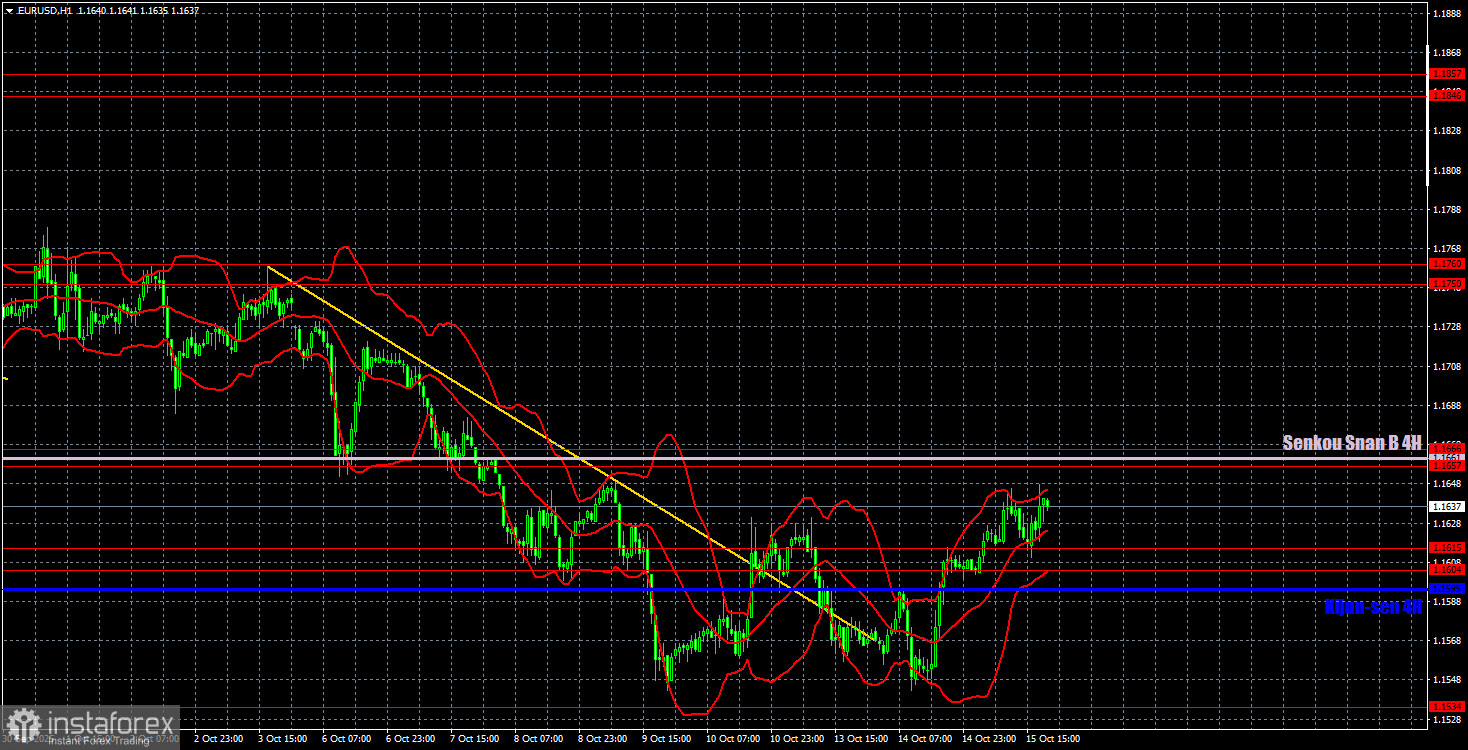
On the hourly timeframe, the EUR/USD pair likely completed its most recent downward correction last week. The trendline has been breached, the Kijun-sen line has been overcome, and the 1.1604–1.1615 zone has been cleared. As such, there is room for growth toward the Senkou Span B line. We believe the euro is long overdue for a recovery, though the market has been reluctant to price it in—despite ample justification.
On October 16, we highlight the following levels for trading: 1.1234, 1.1274, 1.1362, 1.1426, 1.1534, 1.1604-1.1615, 1.1657-1.1666, 1.1750-1.1760, 1.1846-1.1857, 1.1922, 1.1971-1.1988, as well as the Senkou Span B (1.1661) and Kijun-sen (1.1595) lines. Keep in mind that Ichimoku lines can shift during the day, so traders should adjust accordingly when identifying valid signals. Remember to use a breakeven Stop Loss once the price moves 15 pips in your favor to safeguard against potential losses in case of false breakouts.
On Thursday, ECB President Christine Lagarde is scheduled to speak—her tenth appearance in just over two weeks. Her message remains consistent: the ECB has no plans to change its policy stance in the near future. Macroeconomic calendars in the U.S. are empty for the day.
Trading Recommendations:
On Thursday, traders can continue working with the 1.1604–1.1615 zone.
- A bounce from this area can justify long entries targeting 1.1657–1.1666
- A break below this zone and the Kijun-sen line would validate short positions targeting 1.1534
Chart Explanations:
- Thick red lines – key support/resistance levels; potential price targets, not trade signals by themselves
- Kijun-sen and Senkou Span B – Ichimoku lines transferred from the 4-hour to the 1-hour chart; considered strong technical markers
- Thin red lines – local highs/lows that previously caused reversals; can be used for entry/exit points
- Yellow lines – trendlines, channels, and other technical formations
- Indicator 1 on COT charts – size of the net position for trader categories


