


EUR/USD 5-Minute Chart Analysis
On Thursday, the EUR/USD currency pair showed a volatility of about 40 pips. There were no movements throughout the day, offering nothing to trade. There were also no significant events in either the Eurozone or the U.S. As for Christine Lagarde's speeches, they no longer qualify as market-moving events. Over the last three weeks, Lagarde has spoken around ten times. Her message has been consistent: the European Central Bank sees no reason to change its monetary policy in the near future. Accordingly, traders had no reason to react, and no new impulses appeared. Still, the pair maintained its newly formed upward trend, did not retreat, and broke through the Senkou Span B line, which is a key technical milestone.
Technical analysis continues to suggest further growth in the euro. First, an upward trend remains in place on the daily timeframe. Second, the descending trendline and Ichimoku indicator levels on the hourly chart have been broken. This creates grounds to expect continued euro strength. Besides technicals, macroeconomic and fundamental factors also support further EUR appreciation. At the moment, we can't identify any meaningful reasons for dollar strength.
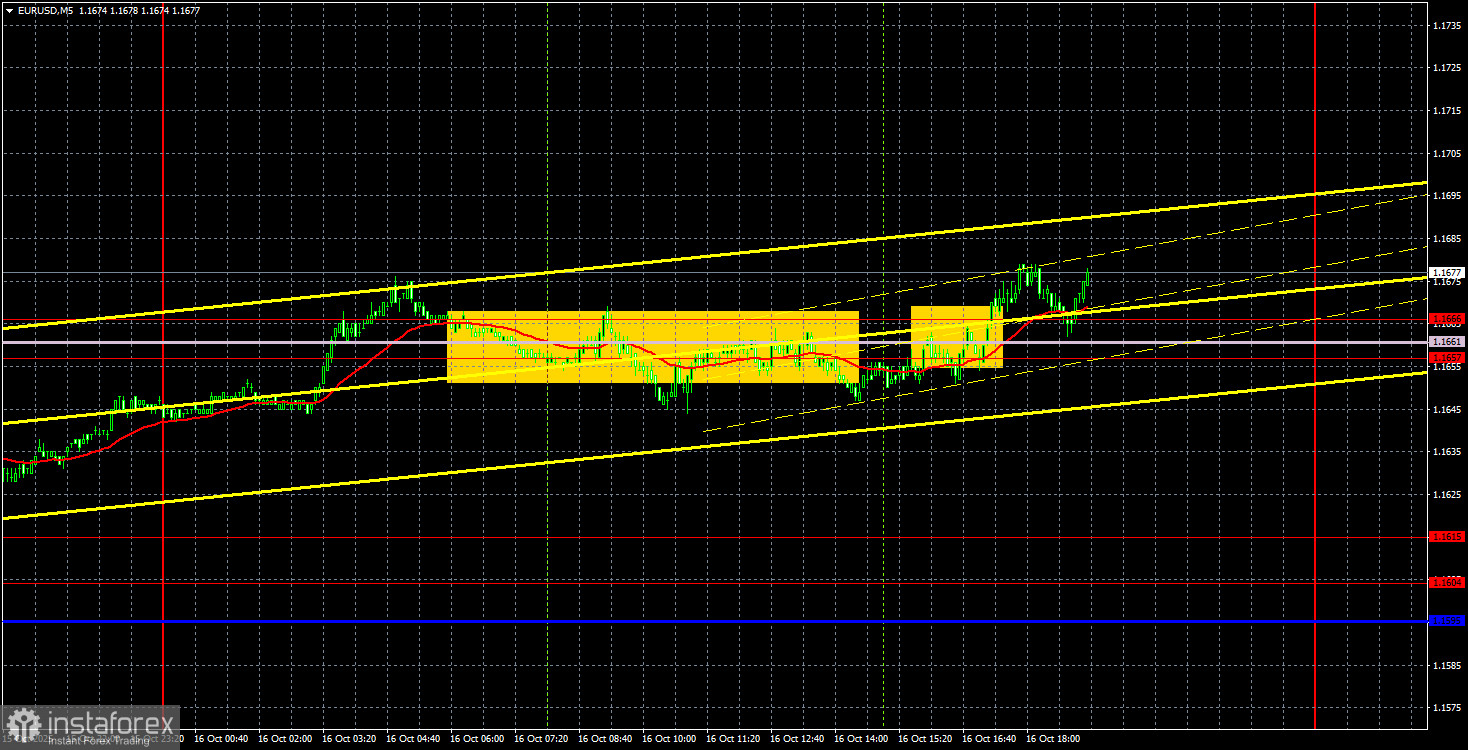
On the 5-minute timeframe, yesterday's trade signals were underwhelming. As we've mentioned before, if the market is not moving, there's no point in relying on signals, levels, or indicators—there won't be profits. Yesterday exemplified that perfectly. The price spent the entire day hovering between 1.1657 and 1.1666, only managing to settle above that range later in the evening. However, the euro still failed to push higher even after that.
COT Report
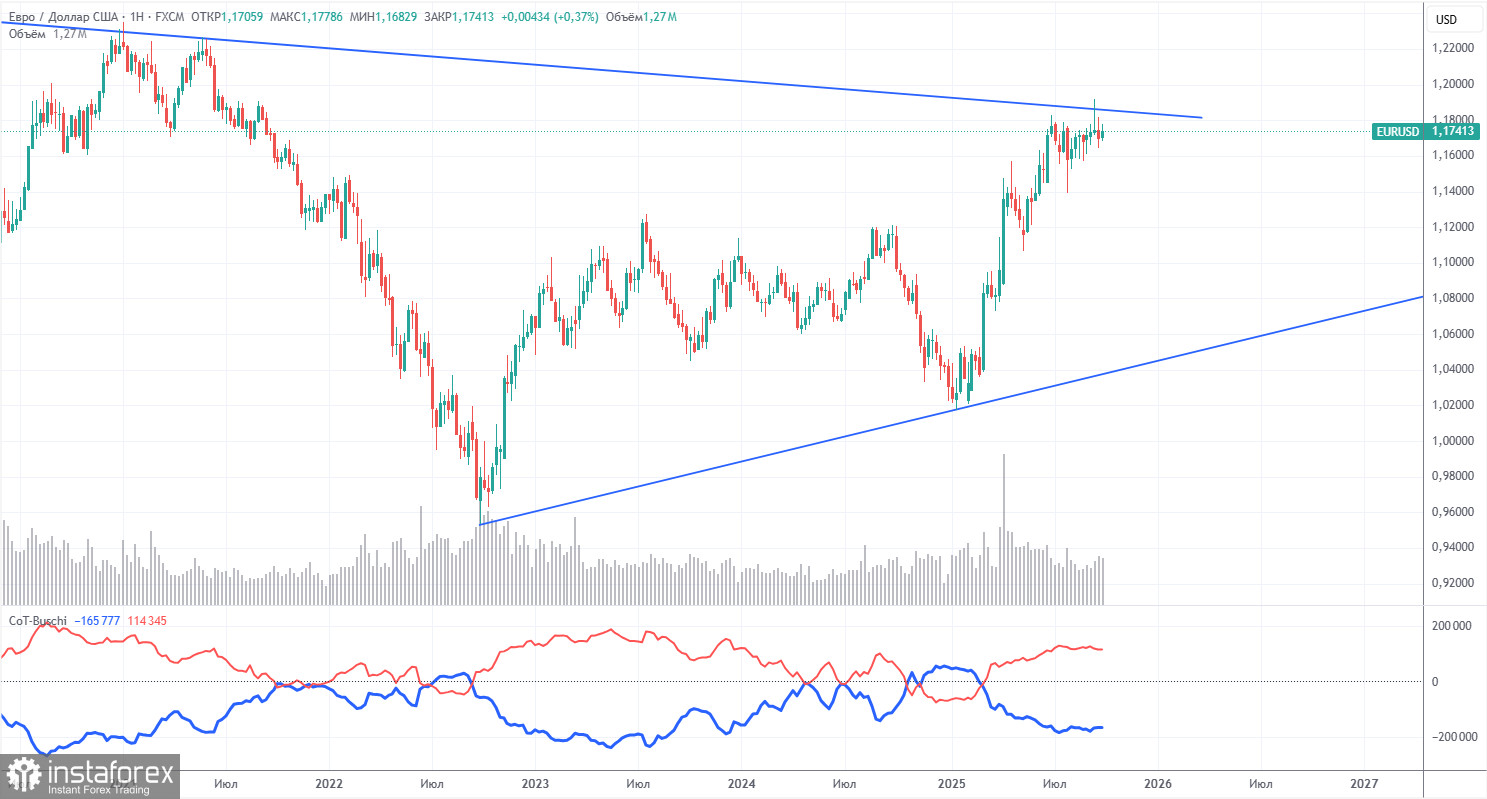
The latest COT (Commitment of Traders) report is dated September 23. The chart clearly shows that net positioning from non-commercial traders has been bullish for an extended period. Bears briefly took control at the end of 2024 but quickly lost it. Since Donald Trump returned to the White House, the dollar has consistently declined. While we cannot say with 100% certainty that the fall will continue, current global developments strongly suggest this possibility.
We still do not observe any compelling fundamental drivers for a stronger euro, but there is no shortage of bearish factors weighing down the U.S. dollar. The global downturn for the dollar remains intact, and historical price action from the past 17 years seems irrelevant now. Unless Trump ultimately ends his trade wars, it's unlikely the dollar will stage a sustainable recovery. Potential loss of Federal Reserve independence is another decisive negative factor for the greenback.
The red and blue COT indicator lines suggest that the bullish trend remains in place. During the latest reporting week, the number of long positions held by the "non-commercial" group declined by 800 contracts, while short positions rose by 2,600 contracts. As a result, the net position decreased by 3,400 contracts.
EUR/USD 1-Hour Chart Analysis
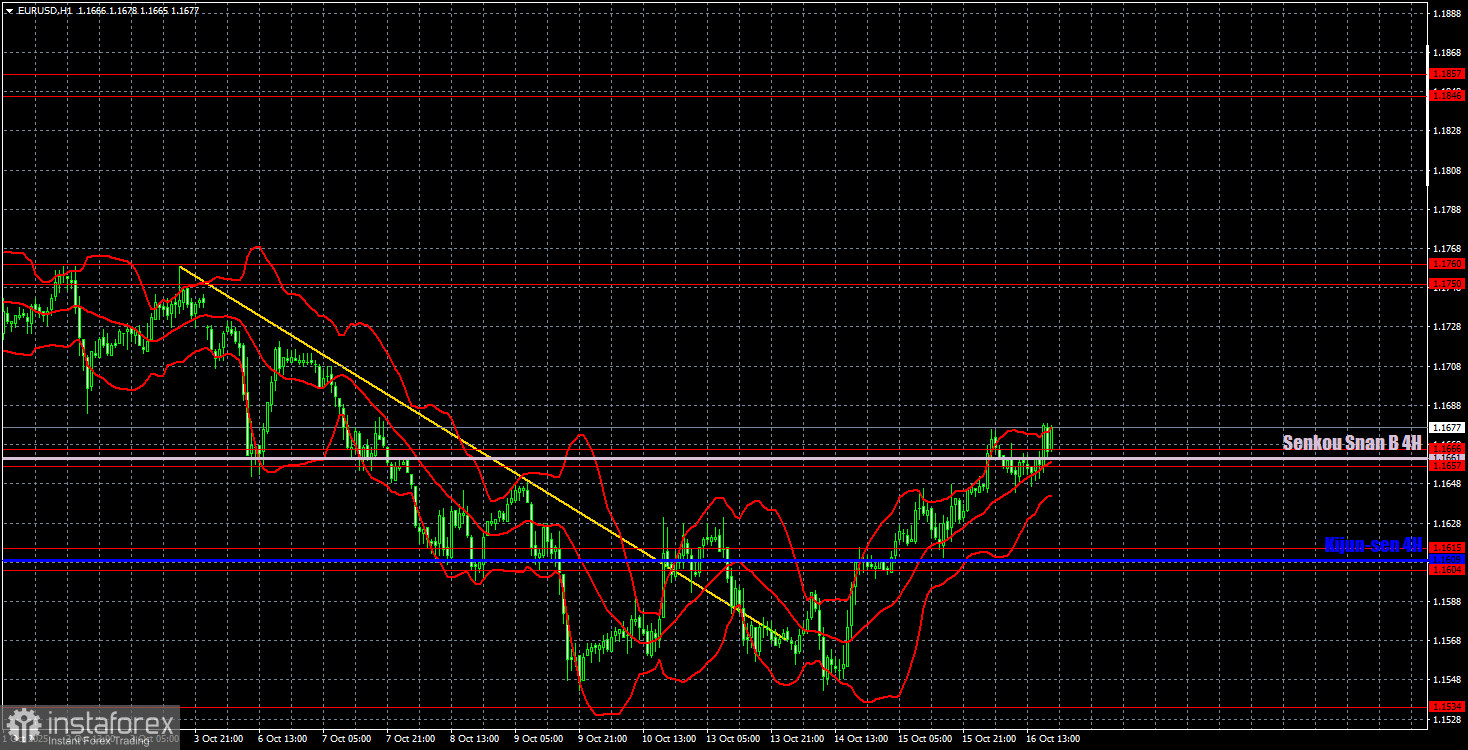
On the hourly timeframe, the EUR/USD pair likely ended its downward trend last week. The downtrend line has been broken. The Kijun-sen line has been surpassed. The 1.1604–1.1615 and 1.1657–1.1666 zones have both been breached. The Senkou Span B line has also been broken. At this point, only continued upward movement is expected. We believe the euro should already be moving higher, but market participants are still hesitant to commit to long positions—even though the conditions are fully supportive of such a move.
For October 17, we define the following levels for trading: 1.1234, 1.1274, 1.1362, 1.1426, 1.1534, 1.1604–1.1615, 1.1657–1.1666, 1.1750–1.1760, 1.1846–1.1857, 1.1922, and 1.1971–1.1988, along with Senkou Span B (1.1661) and Kijun-sen (1.1609) lines. Note: Ichimoku lines may shift throughout the day and should be accounted for when determining signal strength. Always place Stop Loss orders once the price moves 15 pips in the expected direction to lock in profits or limit losses in case the signal proves false.
No significant events or reports are scheduled on Friday for the Eurozone or U.S., meaning traders may again face a market devoid of triggers, with low volatility likely to persist.
Trading Recommendations:
On Friday, traders can continue to trade from the 1.1657–1.1666 zone. A bounce from the top of this area will validate long positions targeting 1.1750–1.1760. A confirmed breakdown below this zone will allow for short trades with a target of 1.1615.
Chart Illustration Key:
- Thick red lines represent key support/resistance price levels. These are reference levels where movement may pause or reverse. They do not generate signals themselves.
- Kijun-sen and Senkou Span B are Ichimoku indicator lines transferred from the H4 timeframe to the H1 chart. These are strong support/resistance lines.
- Thin red lines mark price extremes, from where price has previously rebounded. These serve as signal levels.
- Yellow lines represent trend lines, trend channels, and other technical patterns.
- The COT Indicator 1 on the reports shows the net position size of each trader category.


