


EUR/USD
Analysis:
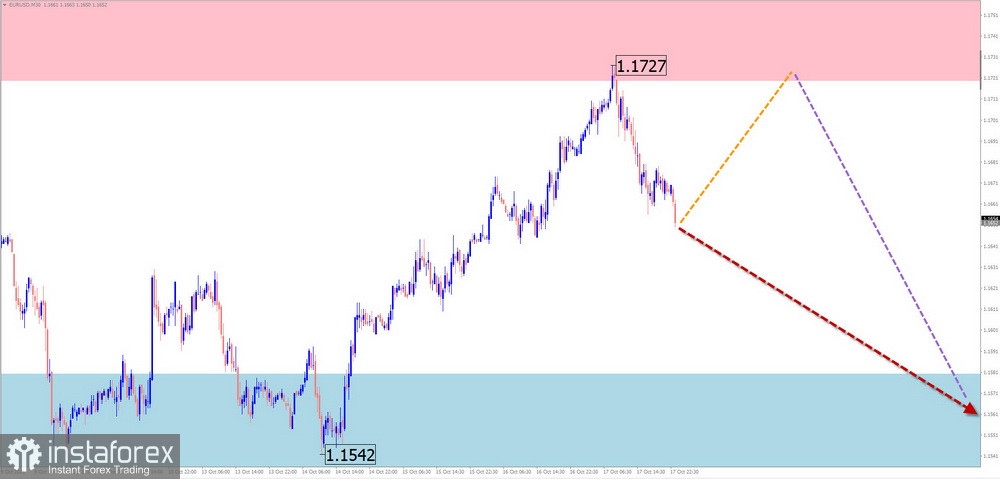
Within the framework of the dominant bullish trend on the euro chart, a counter-wave has been developing since late August, which remains within the bounds of a correction. At the time of analysis, the structure of this wave is incomplete. Its middle part (B) is nearing completion. The price has bounced off strong resistance.
Forecast:
In the coming week, after a period of consolidation, the downward vector is expected to continue. In the first few days, a brief rise is possible, with potential pressure on the upper resistance zone. Afterwards, a reversal and resumption of the bearish course of the euro are anticipated.
Potential Reversal Zones
Resistance: 1.1720 / 1.1770
Support: 1.1580 / 1.1530
Recommendations:
Sell: After reversal signals appear near the resistance area on your trading systems.
Buy: Low potential, high risk.
USD/JPY
Analysis:
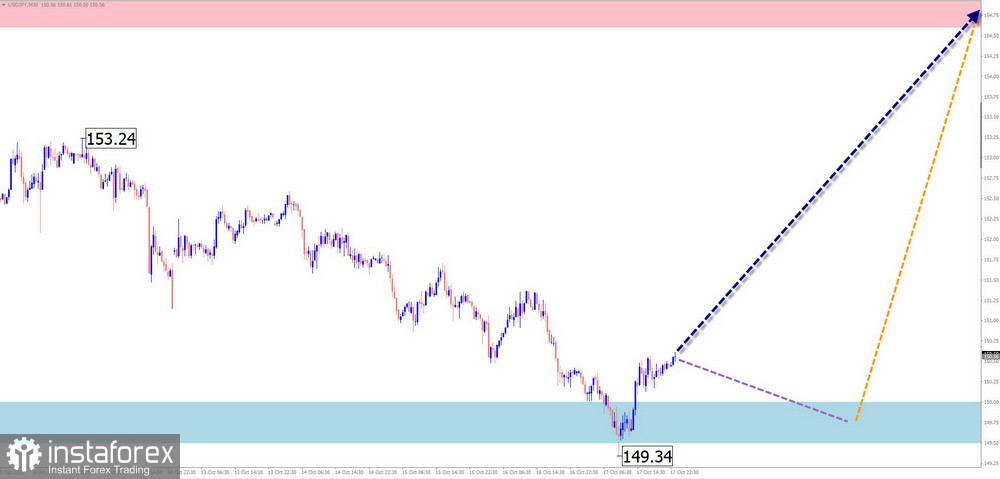
The dominant upward wave that started in April has brought the pair into a powerful potential reversal zone on the higher time frame. Wave structure analysis shows that a downward segment with reversal potential began about a decade ago. If confirmed, this would signal a change in the short-term trend. Prices are currently squeezed between strong opposing levels.
Forecast:
The start of the upcoming week is expected to be in a sideways range, with price movement along the support zone. Pressure on this zone is possible, including a brief decline below its lower boundary. In the second half of the week, a trend reversal, increased volatility, and a rise in the pair's price are expected.
Potential Reversal Zones
Resistance: 154.60 / 155.10
Support: 150.00 / 149.50
Recommendations:
Buy: After confirmed reversal signals appear near the support zone.
Sell: No suitable conditions in the current market.
GBP/JPY
Analysis:
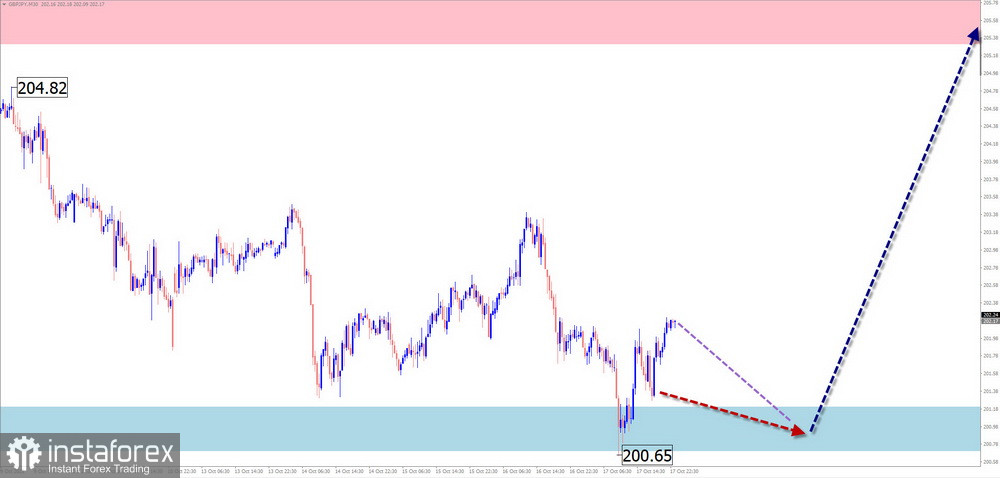
The incomplete section of the dominant upward trend in the GBP/JPY pair has been developing since September 11. The price has reached the lower boundary of a large-scale potential reversal zone. Within the final segment of the wave, a corrective structure with reversal potential has been forming over the past week.
Forecast:
In the coming week, the price is expected to continue moving within the corridor between the nearest opposing zones. Early in the week, pressure on the support zone is possible, followed by a reversal and upward movement. The price rise may continue up to the resistance boundaries.
Potential Reversal Zones
Resistance: 205.30 / 205.80
Support: 201.20 / 200.70
Recommendations:
Sell: Possible with reduced volume size for intraday trading.
Buy: After confirmed reversal signals appear near the support zone on your trading systems.
USD/CAD
Analysis:
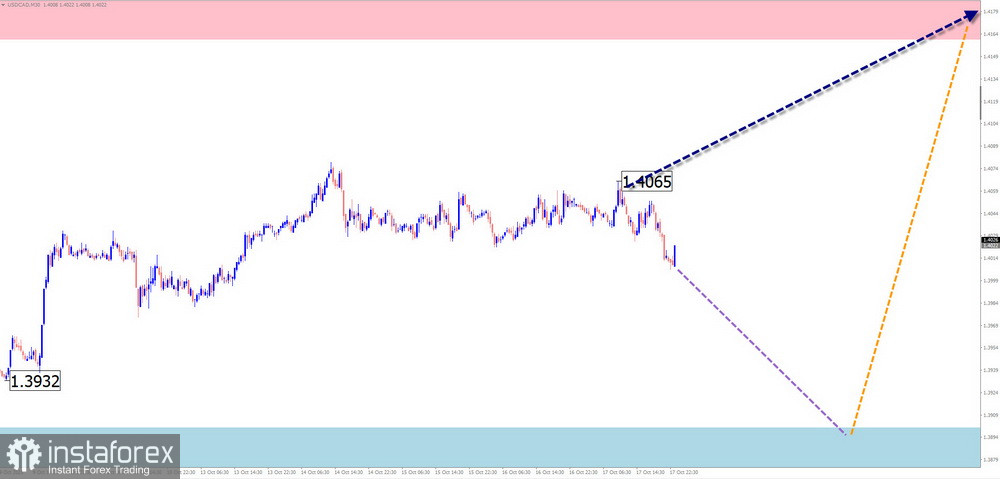
The short-term price direction of the Canadian dollar has been defined by a downward trend since February of this year. In mid-June, quotes reached the upper boundary of a major potential reversal zone. Since then, the pair has been forming an incomplete corrective wave, now in its final phase.
Forecast:
At the beginning of the upcoming week, continued sideways movement is expected, possibly with a decline along the support level. Then, a reversal and resumption of the pair's upward course are anticipated. The rise may continue up to the calculated resistance zone.
Potential Reversal Zones
Resistance: 1.4160 / 1.4210
Support: 1.3900 / 1.3850
Recommendations:
Buy: After reversal signals appear near the support zone on your trading systems.
Sell: Risky, with low potential.
NZD/USD
Brief Analysis:
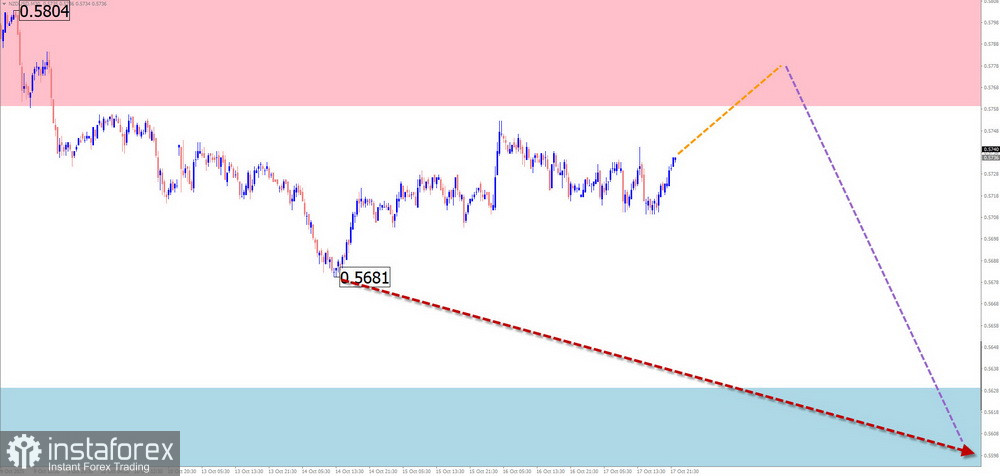
Since April, the daily time frame of the New Zealand dollar has been in an upward wave. Over the past three months, however, the pair has been moving mainly downward. The current incomplete correction wave began on July 1. After breaking another strong support level last week, the pair has formed an unfinished horizontal pullback.
Weekly Forecast:
At the beginning of the coming week, the NZD is expected to continue its sideways movement, with possible pressure on the resistance zone. A reversal is likely later in the week, with the price decline expected toward the support zone.
Potential Reversal Zones
Resistance: 0.5760 / 0.5810
Support: 0.5630 / 0.5580
Recommendations:
Sell: After confirmed reversal signals appear near the resistance zone.
Buy: Risky and potentially unprofitable.
GOLD
Analysis:
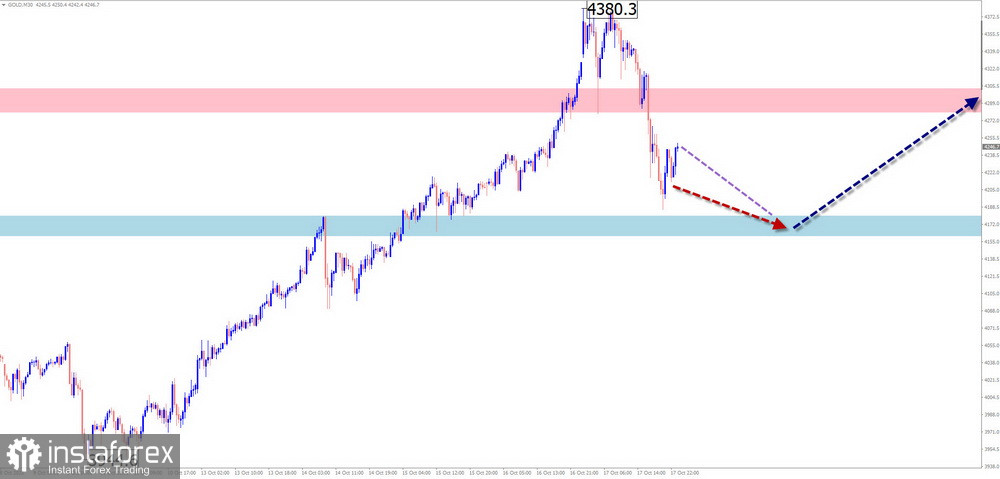
The price trend of gold over the past two years has been defined by an upward wave. Since mid-August, an incomplete section of the main trend has been developing upward. At the end of last week, the price bounced off the upper boundary of a broad weekly-scale potential reversal zone. The current downward segment has reversal potential.
Forecast:
In the coming week, the decline that began last week is expected to continue. The most probable completion area of the decline lies near the calculated support level. Afterwards, a reversal and resumption of the upward course are expected. The weekly rise is limited by the calculated resistance zone.
Potential Reversal Zones
Resistance: 4280.0 / 4300.0
Support: 4180.0 / 4160.0
Recommendations:
Buy: Limited potential, may be risky.
Sell: Premature until confirmed reversal signals appear on your trading systems.
Notes: In simplified wave analysis (SWA), all waves consist of three parts (A–B–C). In each time frame, the analysis focuses on the last, incomplete wave. Expected movements are shown with dashed lines.
Attention: The wave algorithm does not take into account the duration of movements over time!


