


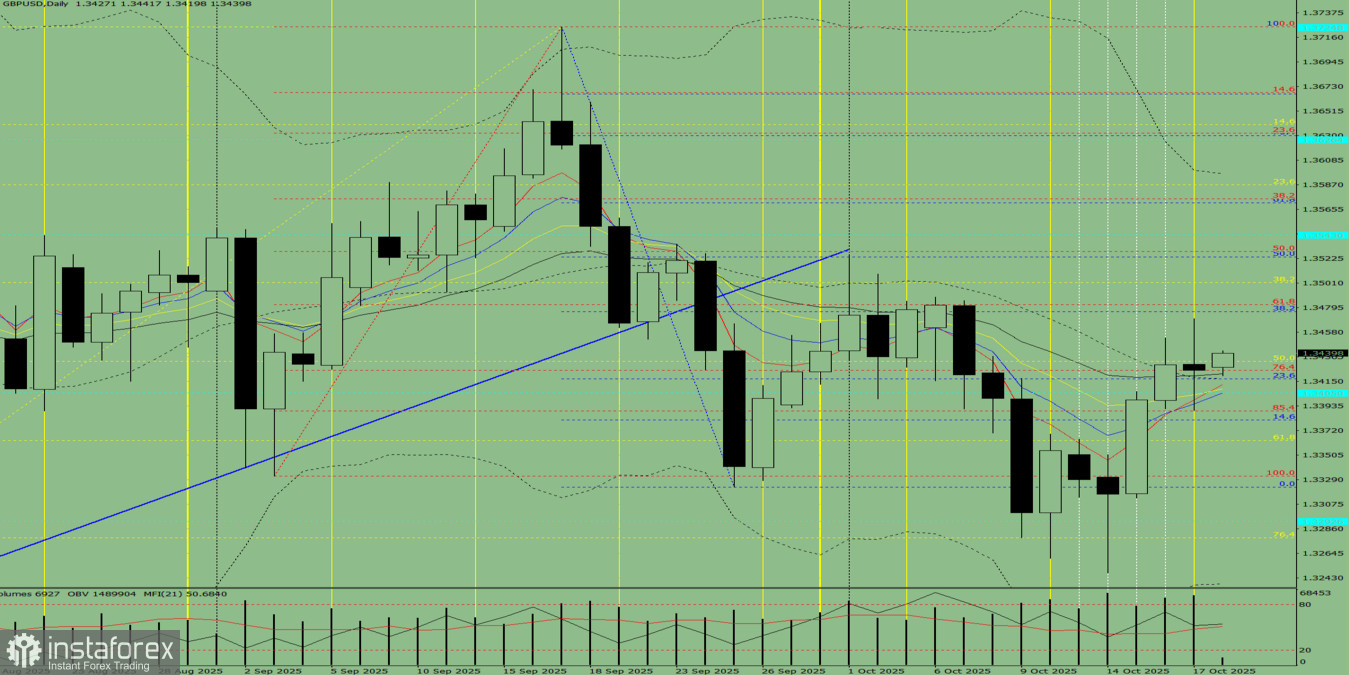
Fig. 1 (Daily Chart)
Comprehensive Analysis:
- Indicator analysis — upward
- Fibonacci levels — upward
- Volume — upward
- Candlestick analysis — upward
- Trend analysis — upward
- Bollinger Bands — upward
- Weekly chart — upward
Overall conclusion: Upward trend.
Alternative Scenario:
From the level of 1.3425 (the closing price of Friday's daily candle), the price may begin an upward movement toward 1.3432 — the 50% retracement level (yellow dashed line). Upon reaching this level, a downward movement is possible toward 1.3408 — the historical resistance level (blue dashed line).


