


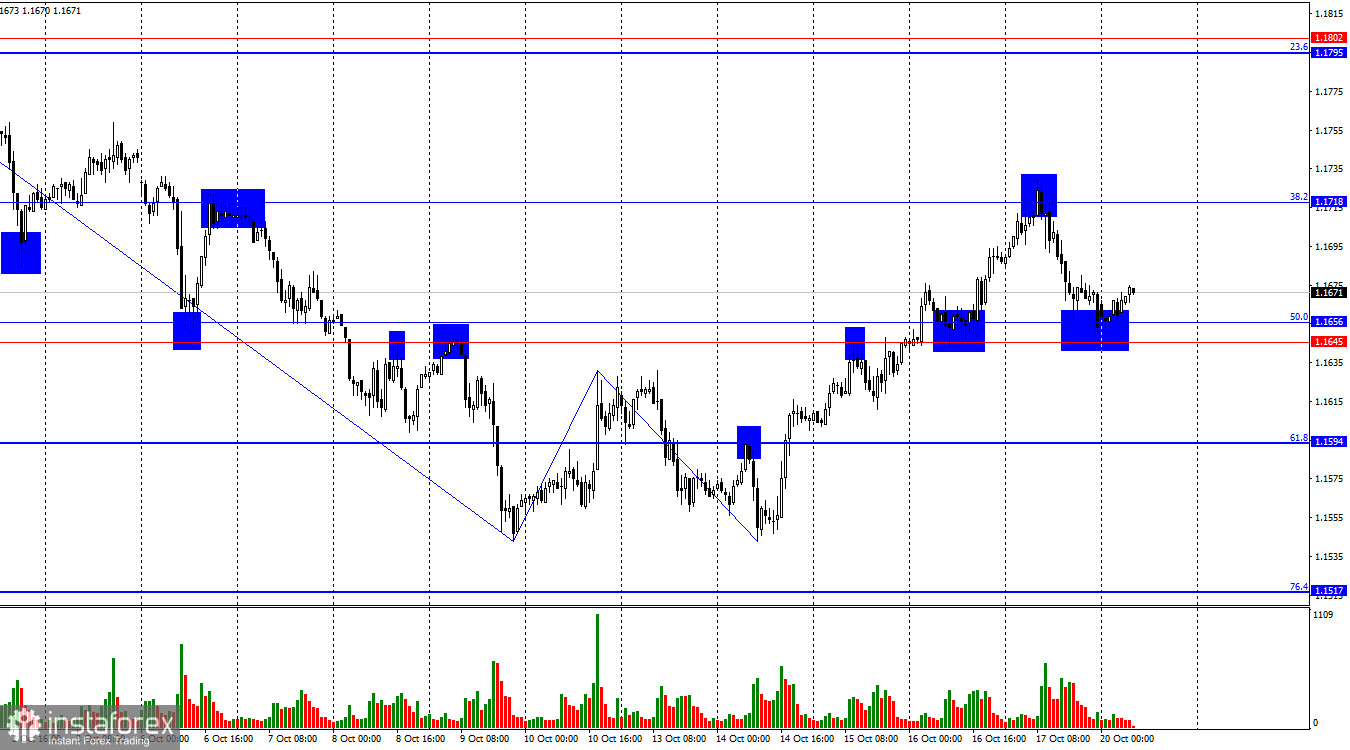
On Friday, the EUR/USD pair rebounded from the 38.2% Fibonacci retracement level at 1.1718, turned in favor of the U.S. dollar, and fell to the support zone 1.1645–1.1656. A rebound from this zone would work in favor of the European currency, resuming growth toward 1.1718. If the pair consolidates below the 1.1645–1.1656 level, it will increase the likelihood of continued decline toward the next Fibonacci retracement level at 61.8% (1.1594).
The wave pattern on the hourly chart remains simple and clear. The last upward wave broke above the previous peak, while the last completed downward wave failed to break below the previous low. Thus, the trend has now shifted to bullish. Recent labor market data, changed FOMC monetary policy expectations, new U.S. aggression toward China, and the ongoing government shutdown all support the bullish side.
On Friday, there were no strong reasons for bullish traders to retreat. However, Donald Trump slightly softened his rhetoric toward China, stating that the two countries might soon sign a trade agreement. The market immediately reacted with a surge of optimism.
Let me remind you that Trump has been pressuring China throughout 2025. Tariff rates on imports keep changing — they rise, then fall. The U.S. president constantly alternates between announcing negotiations and increasing tariffs, effectively nullifying any progress made in earlier discussions.
At this point, there is no trade deal, despite Trump talking about it for several months. What actually exists is an escalating trade war that grows worse by the day. China continues to respond blow for blow, while the U.S. reacts to every Chinese move as an act of hostility or disrespect. There is no end in sight to this conflict.
I believe another escalation — or even a complete breakdown of relations between Beijing and Washington — is far more likely than a trade deal by the end of 2025. Thus, I see no reason to buy the dollar, especially amid a bullish trend.
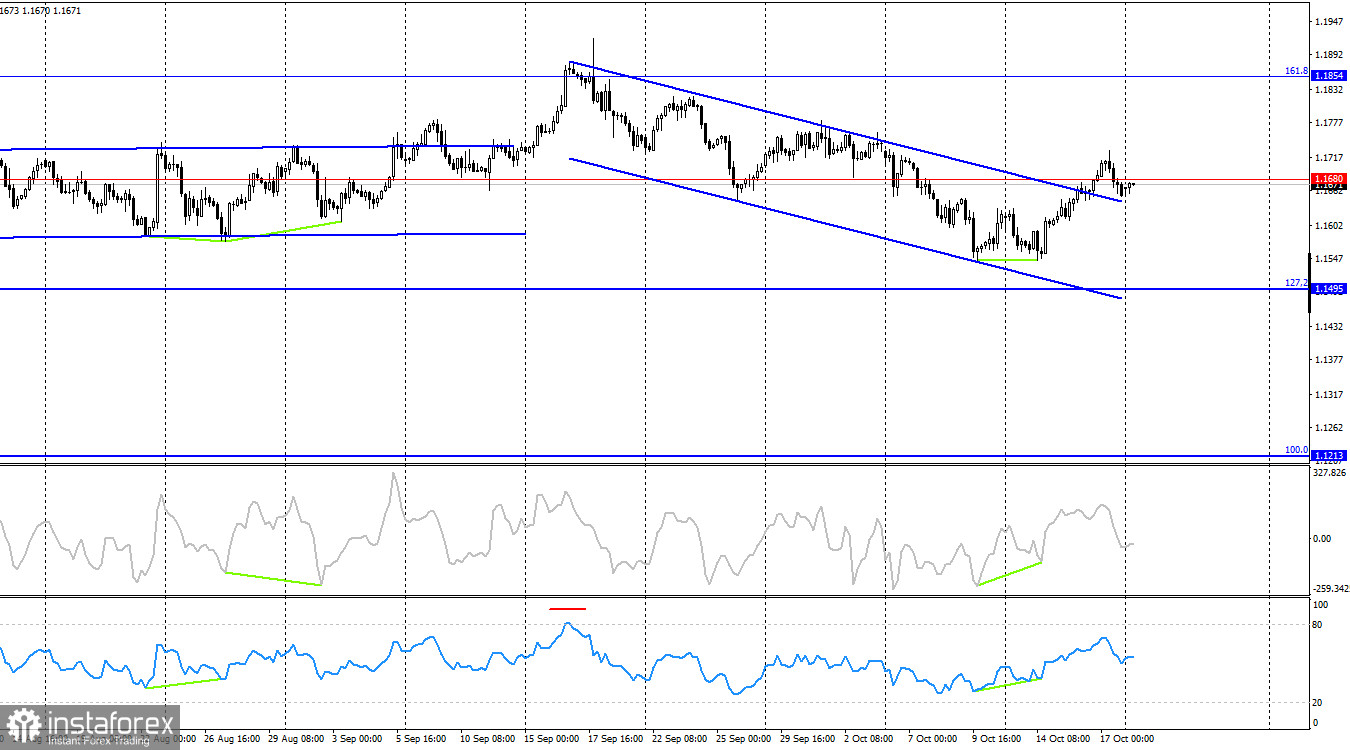
On the 4-hour chart, the pair consolidated above 1.1680 and the downward trend channel after forming a bullish divergence on the CCI indicator. Therefore, the upward movement may continue toward the next Fibonacci retracement level at 161.8% (1.1854). This is yet another factor in favor of bullish traders and the decline of the U.S. dollar. No new emerging divergences are observed today on any indicator.
Commitments of Traders (COT) Report:
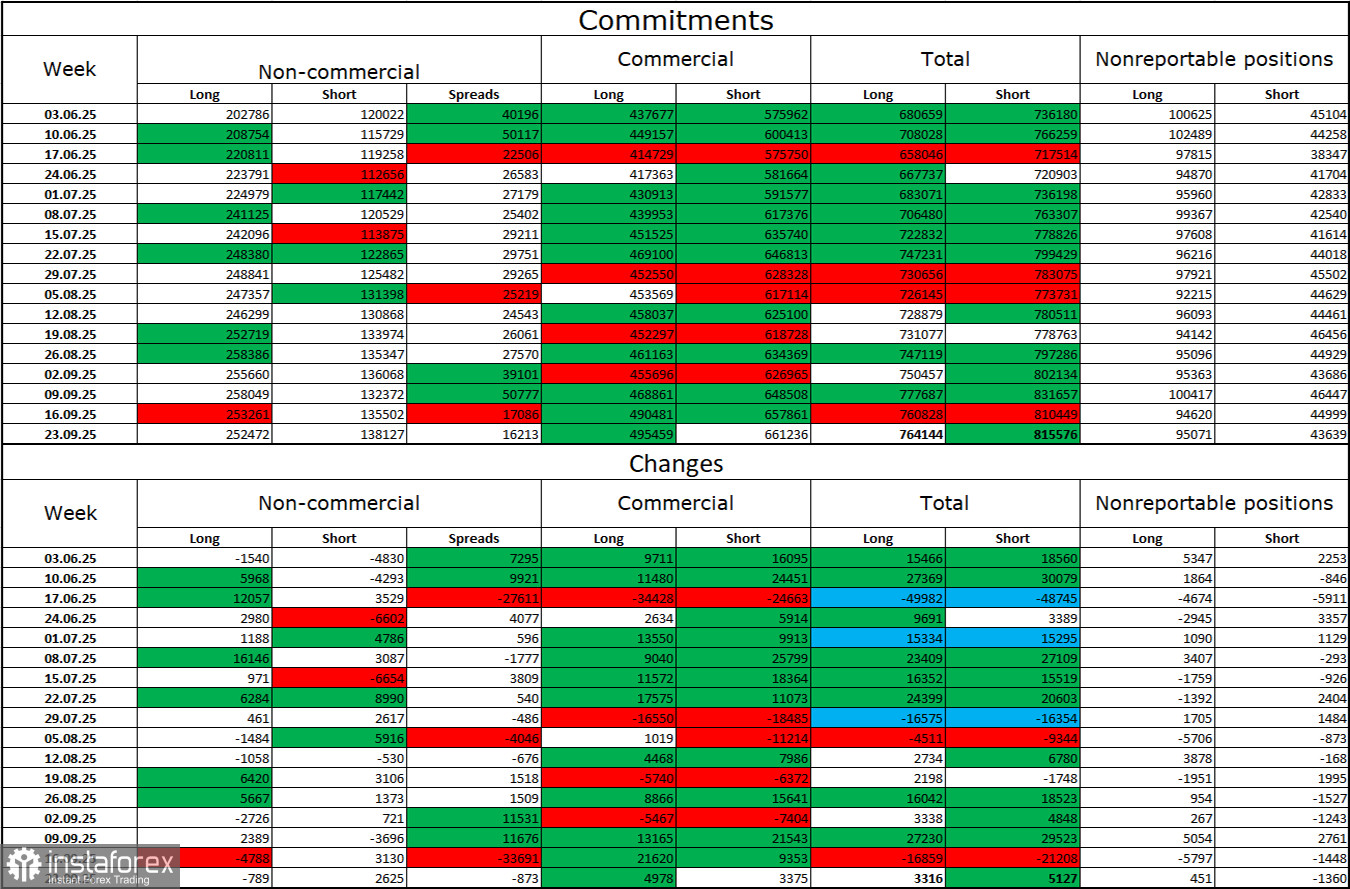
During the last reporting week, professional traders closed 789 long positions and opened 2,625 short positions. Despite this, the sentiment of the "Non-commercial" group remains bullish, largely thanks to Donald Trump, and continues to strengthen over time.
The total number of long positions held by speculators is now 252,000, while short positions amount to 138,000 — nearly a twofold difference.
Also, note the large number of green cells in the table above, which indicate strong growth in positions favoring the euro. In most cases, interest in the euro is increasing, while interest in the dollar is declining.
For 33 consecutive weeks, large traders have been reducing short positions and increasing long positions. Donald Trump's policies remain the most significant factor for traders, as they may cause long-term structural problems for the U.S. economy. Despite the signing of several trade agreements, many key economic indicators continue to show decline.
Economic Calendar for the U.S. and the Eurozone:
October 20: The economic calendar contains no significant events. Thus, the news background will not influence market sentiment on Monday.
EUR/USD Forecast and Trading Recommendations:
Sell positions were possible after a rebound from 1.1718 on the hourly chart with a target at 1.1656 (target reached). New sales can be considered after closing below the 1.1645–1.1656 level, targeting 1.1594. Buy positions can be considered today after a rebound from the 1.1645–1.1656 level, targeting 1.1718.
Fibonacci grids are constructed as follows:
- On the hourly chart — between 1.1392 and 1.1919
- On the 4-hour chart — between 1.1214 and 1.0179


