


Analysis of GBP/USD – 5M Timeframe
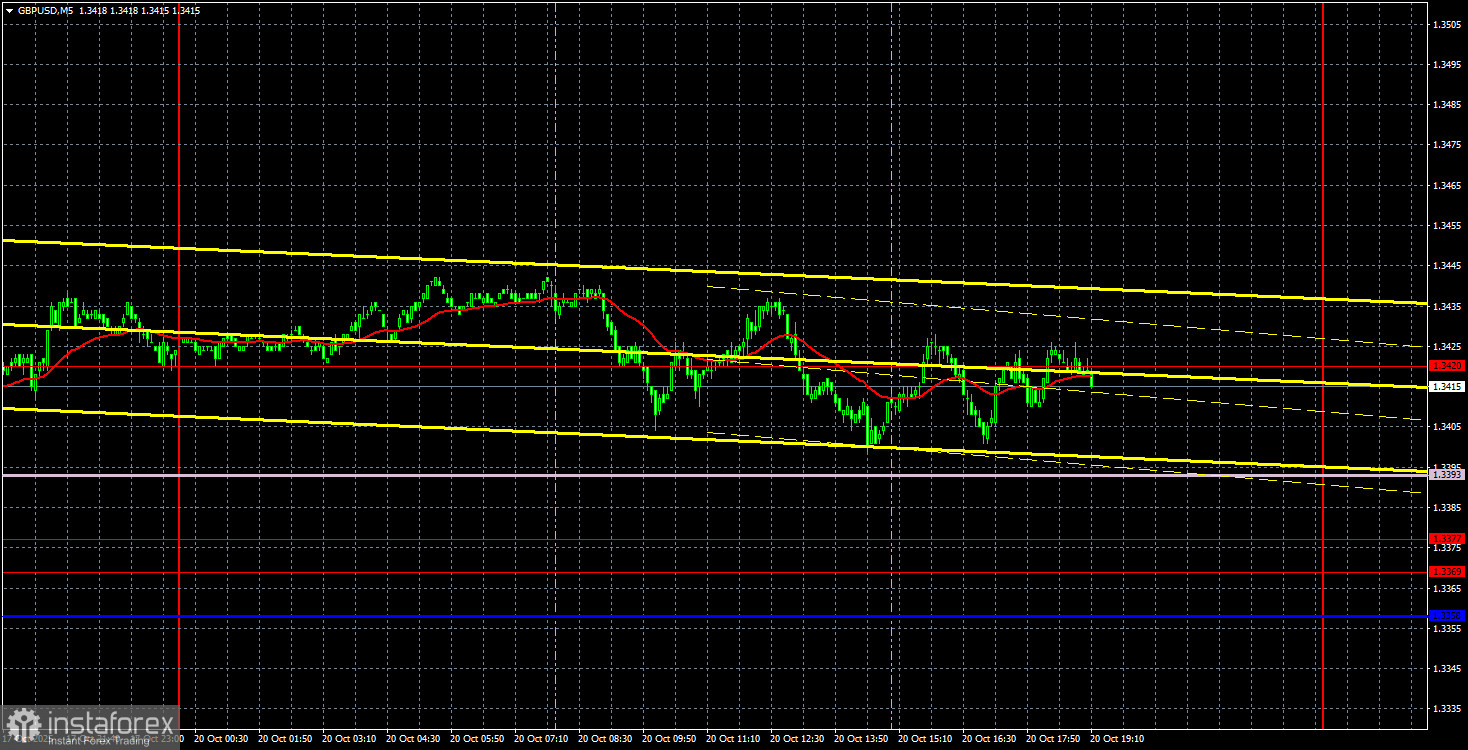
On Monday, the GBP/USD currency pair remained stagnant throughout the day. There were absolutely no macroeconomic or fundamental events, and, even under such quiet conditions, volatility remained extremely low. Over recent months, volatility has been steadily declining, signaling reduced trader activity—something quite typical during flat market phases. It's worth noting that both the euro and the pound are in a sideways trend on the daily timeframes. Within such a flat range, price movements can be completely unpredictable.
This week may bring notable events for both the pound and the dollar, but traders will have to wait. While inflation reports are usually significant, in the current context they are having a modest impact on the market. As such, the uptrend on the hourly timeframe remains technically valid but still lacks momentum. Realistically, no one will be thrilled if the pair continues inching upward at 20 pips per day with constant corrections.
On the 5-minute timeframe, the price broke through the 1.3420 level roughly seven times during the day, with overall daily volatility totaling around 45 pips. Traders may have attempted to open positions early in the session, but we had warned that the likelihood of low volatility was very high.
COT Report (Commitment of Traders)
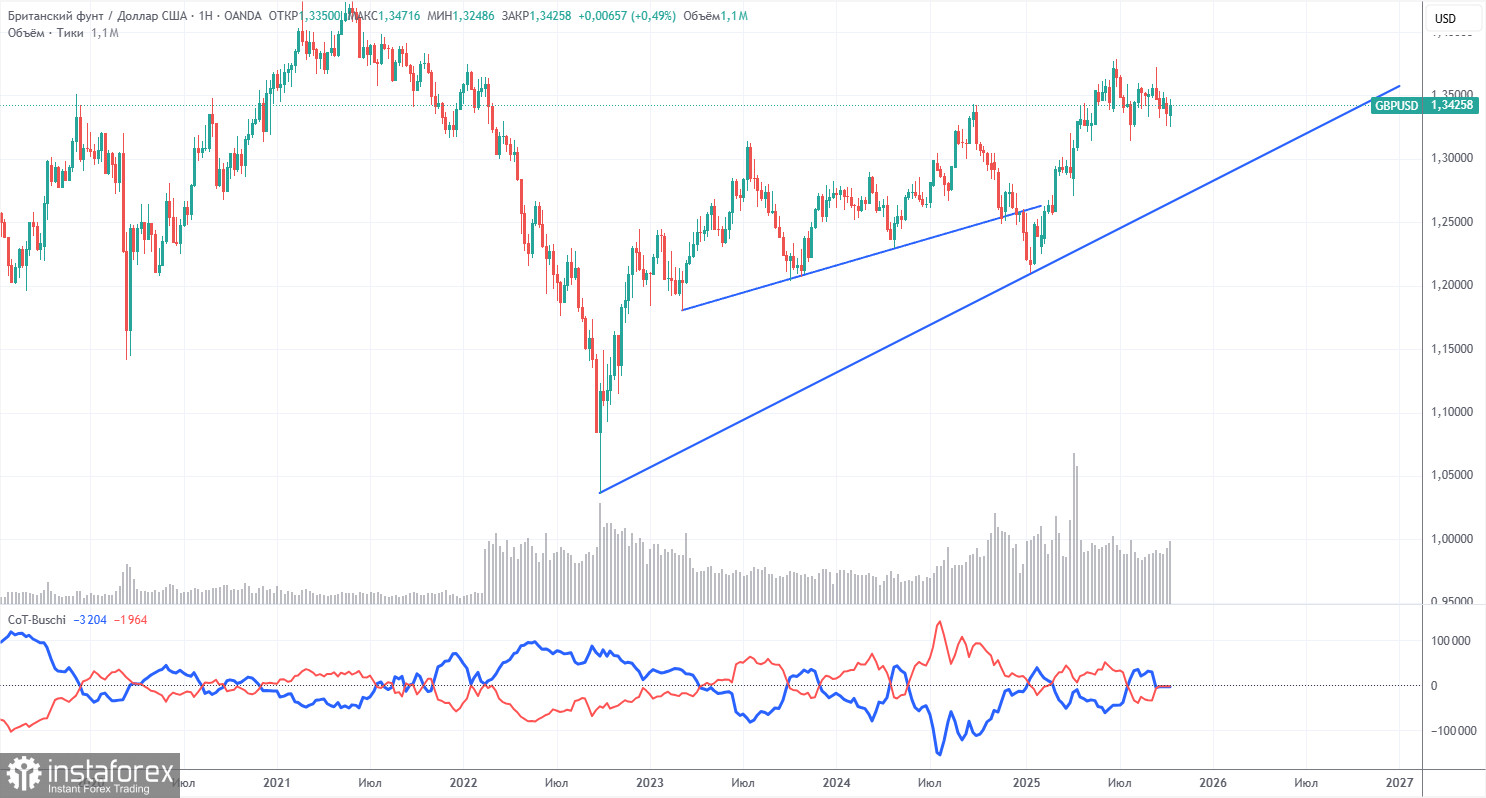
COT data for the British pound shows that commercial traders have been shifting their sentiment frequently in recent years. The red and blue lines, representing net positions of commercial and non-commercial traders, often cross and tend to hover near the zero line. Currently, they are nearly equal, indicating a balanced number of long and short positions.
The U.S. dollar continues to weaken due to the policies of Donald Trump, which makes market makers' interest in the pound Sterling less relevant in the current phase. The ongoing trade war is expected to persist in some form for an extended period. The Federal Reserve is also projected to continue cutting rates over the next year. Demand for the dollar is bound to diminish.
According to the latest COT report for the pound, non-commercial traders opened 3,700 BUY contracts and closed 900 SELL contracts. Thus, the net position among this group increased by 4,600 contracts.
In 2025, the pound has posted significant gains, but the catalyst is clear—Trump's policies. Once that factor dissipates, the dollar may rebound. When that happens, however, remains highly uncertain. Regardless of how the pound's net positions evolve, the U.S. dollar's net position continues to decline—often at a faster pace.
Analysis of GBP/USD – 1H Timeframe
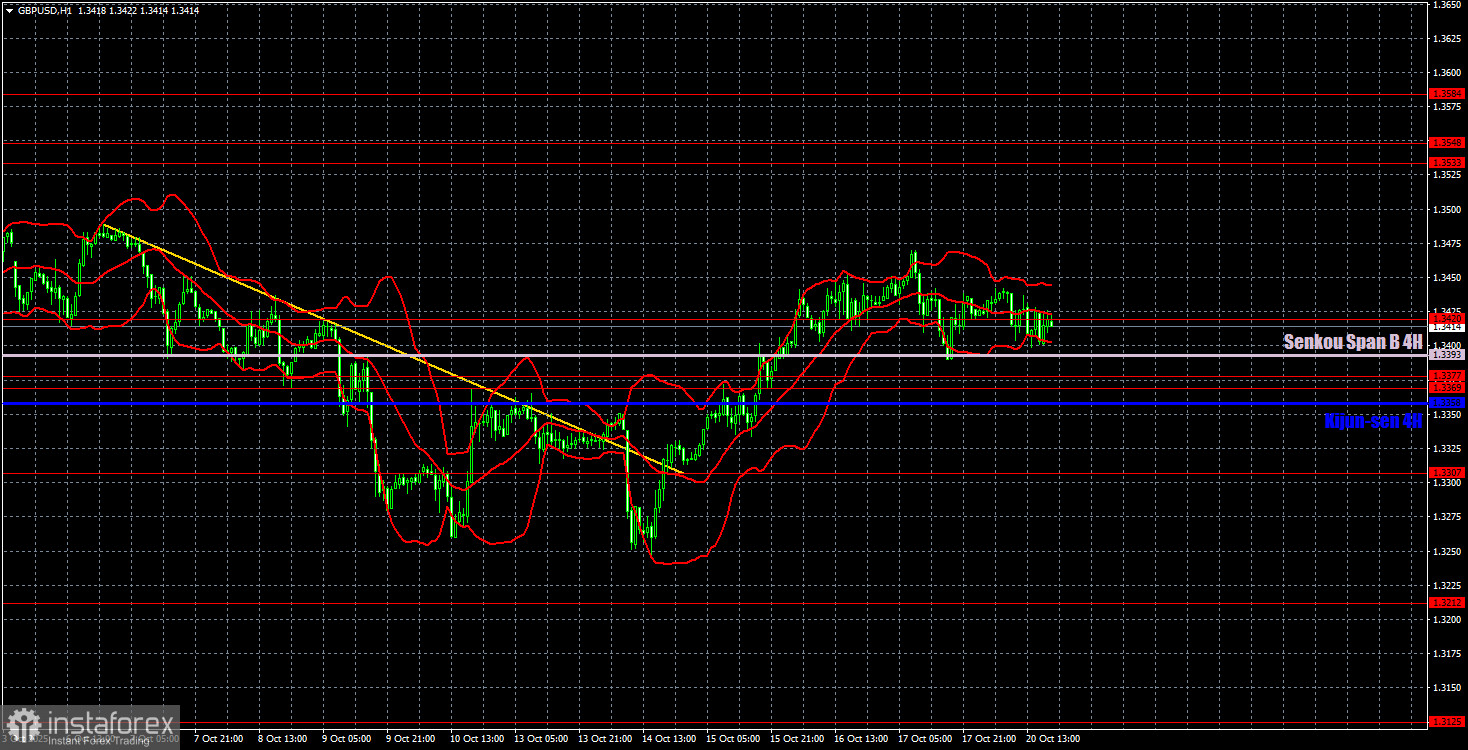
On the hourly chart, the GBP/USD pair has finally completed its downward trend and has begun forming a new bullish structure. The U.S. dollar still lacks fundamental reasons to strengthen, so we expect the pair to continue rising toward its 2025 highs in almost any scenario. The primary concern is whether the flat trading on the daily timeframe will continue for several more weeks. Nonetheless, it's already evident that the Trump-driven trade war continues to escalate, tensions are rising, and the Federal Reserve remains committed to monetary easing. This is a toxic cocktail for the U.S. dollar.
Key levels for October 21: 1.3125, 1.3212, 1.3307, 1.3369–1.3377, 1.3420, 1.3533–1.3548, 1.3584, 1.3681, 1.3763, 1.3833, 1.3886. Additionally, the Senkou Span B line (1.3393) and the Kijun-sen line (1.3358) may generate signals during the trading day. A Stop Loss should be moved to breakeven after a 20-pip favorable movement. Note: Ichimoku indicator lines may shift throughout the day and should be monitored accordingly for accurate signal generation.
For Tuesday, no major events are scheduled in either the U.S. or the United Kingdom, meaning another flat, low-volatility market day is likely.
Trading Recommendations:
Today, traders may initiate trades from the 1.3420 level or from the Senkou Span B line. There are multiple support levels located below the market, while incoming news remains limited. The British pound has started to rise, so in the short term, continued upward movement is expected toward the 1.3533–1.3548 area. However, the likelihood of a flat session with minimal price movement remains high.
Explanation of Chart Elements:
- Resistance/Support Levels – thick red lines: These are zones where price movement may pause or reverse; they do not generate trading signals by themselves.
- Kijun-sen and Senkou Span B – key lines from the Ichimoku indicator, transferred to the hourly chart from the 4-hour timeframe; they serve as major points of support/resistance.
- Extremes – thin red lines: Previous swing highs or lows from which price historically bounced. They can generate trading signals.
- Yellow lines – include trendlines, channels, and other technical chart patterns.
- COT Indicator 1 (on charts): Shows the net position count by trader category.


