


The EUR/USD currency pair remained in a downward trend throughout Thursday. It feels as though the pair has an anchor tied to its leg, slowly pulling it down. There are no compelling reasons for the U.S. dollar to rise, nor for the euro to fall—yet the pair has been declining for a third consecutive week.
October started on the wrong foot for the dollar. On October 1, the United States entered another government shutdown, famously tied to Donald Trump's policies. It goes without saying that nothing positive comes out of such an event for either the U.S. economy or the U.S. currency. Today, October 24, the shutdown is still ongoing. In just a few more days, it could break the previous record of 35 days in length. Just several weeks ago, most expected it to last only a couple of weeks. So why is the dollar rising?
As a result of the shutdown, key macroeconomic reports, particularly labor and unemployment data, have not been released. The only report published from this series was ADP, and it wasn't just weak—it was negative. The market has had no other data to rely on. And if the labor market is shrinking, it increases the likelihood of a near-term rate cut by the Federal Reserve. So again—why is the dollar rising?
In the Eurozone, meanwhile, everything remains relatively stable. Inflation has been successfully stabilized near 2%, and the latest uptick rules out the potential for further monetary easing by the European Central Bank. As a result, the ECB now maintains a neutral stance—unlike the Fed. So, once again, why is the dollar rising instead of the euro?
Let's not forget the tariffs Donald Trump recently introduced. This month alone, tariffs have been imposed on imported trucks, furniture, and pharmaceuticals. Shortly after, tariffs on all imports from India were raised to 50%. And then came an announcement of a 100% tariff hike on imports from China. So any idea of trade war de-escalation is clearly unfounded. We recall that in the first half of 2025, the trade war was the main reason for the dollar's weakness. So why is the dollar strengthening now?
The key takeaway from all the factors listed above is simple—the fundamentals currently support dollar depreciation. Yet the opposite is happening. The only explanation is the ongoing flat trend on the daily time frame. This explains the irrational nature of the market's short-term movements. Flat periods are generally driven by large players accumulating or distributing positions. Hence, there are no fundamental grounds for the euro's ongoing decline—it's simply happening within a ranging market.
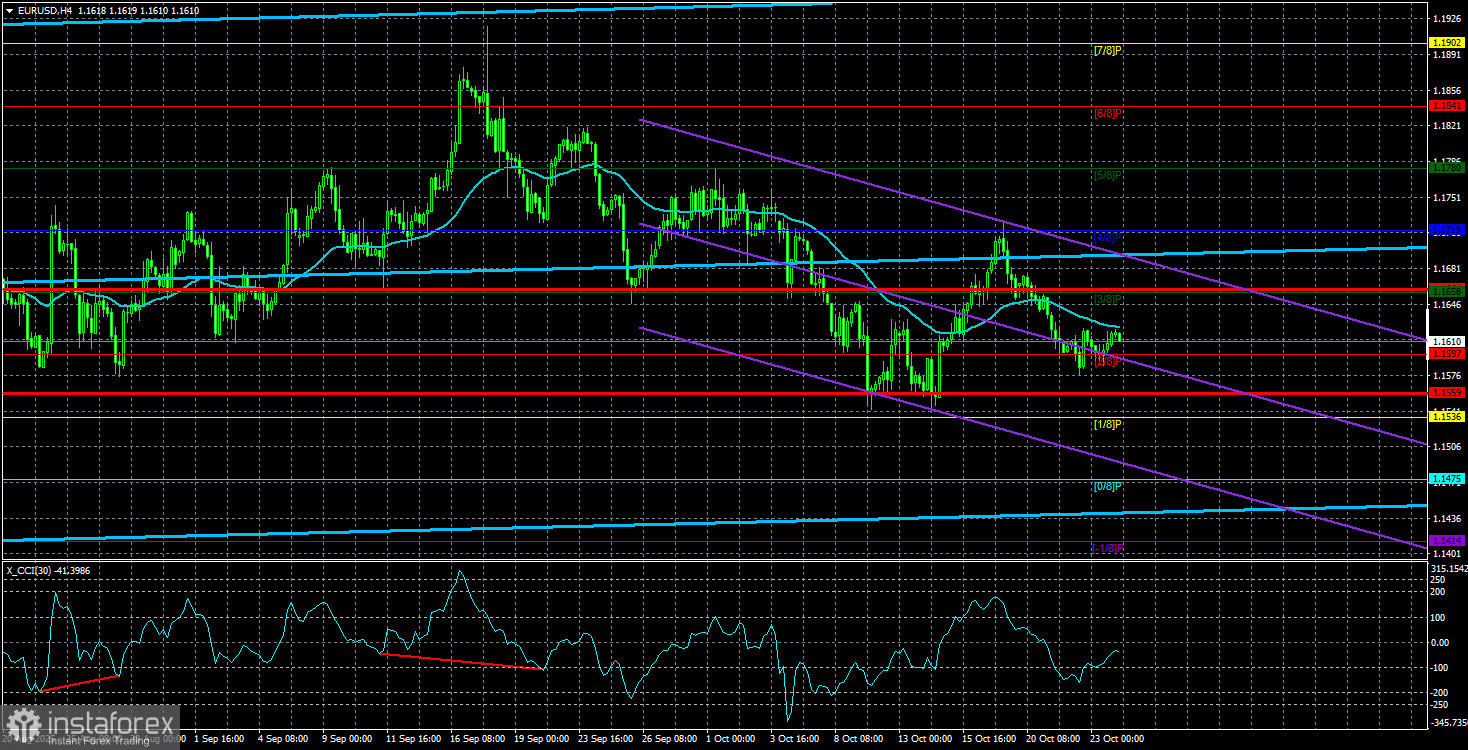
On the daily chart, the previous local low is around 1.1400. This means the euro still has room to fall another 200 pips without breaking out of the flat and disrupting its long-term bullish outlook.
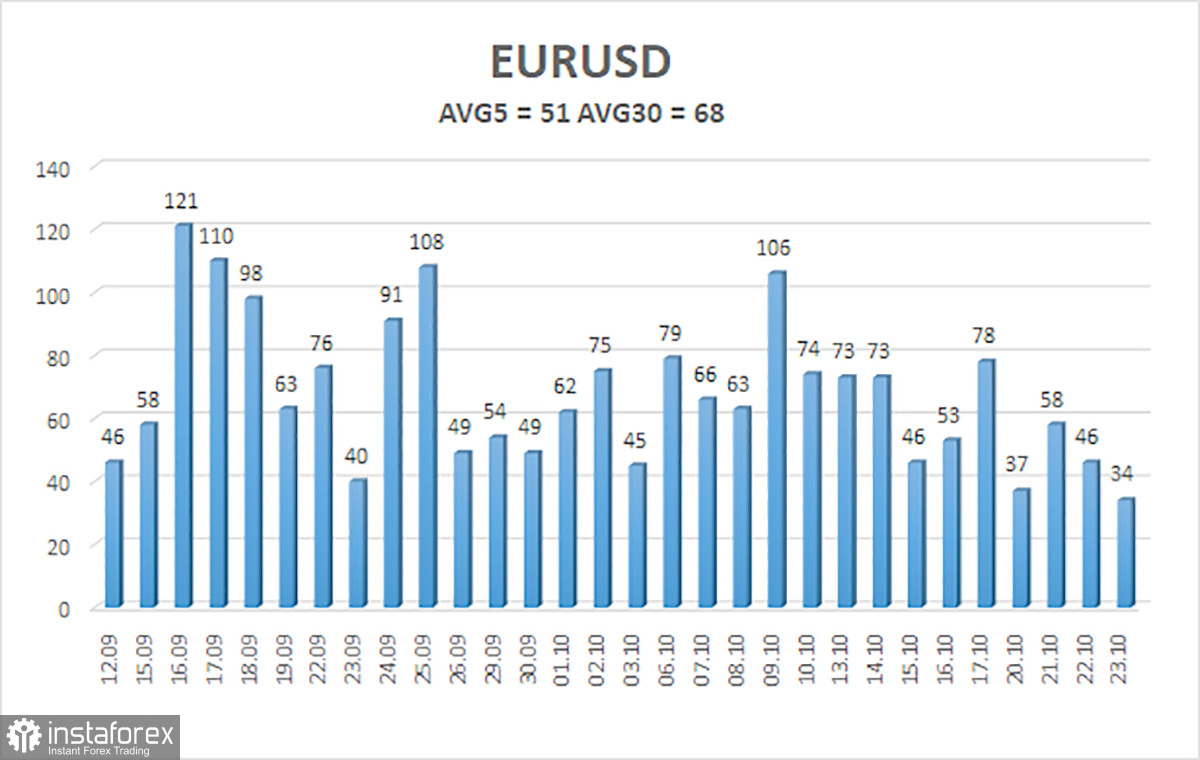
The EUR/USD pair's average volatility over the last five trading days (as of October 24) is 51 pips, which is classified as "average." On Friday, we expect price movement between 1.1559 and 1.1661. The upper linear regression channel is pointed upward, which continues to indicate a bullish trend. Furthermore, the CCI indicator has entered oversold territory, potentially signaling a renewed upward swing.
Nearest Support Levels:
S1 – 1.1597
S2 – 1.1536
S3 – 1.1475
Nearest Resistance Levels:
R1 – 1.1658
R2 – 1.1719
R3 – 1.1780
Trading Recommendations:
EUR/USD is attempting to initiate a new upward trend on the 4-hour chart, while the bullish trend remains intact on all higher time frames. The U.S. dollar remains heavily influenced by Donald Trump's policies, and he shows no signs of pausing or softening. While the dollar has strengthened lately, the reasons are, at best, ambiguous. However, the flat on the daily time frame explains everything.
When the price is trading below the moving average, small short positions may be considered with targets at 1.1559 and 1.1536, based purely on technical conditions. Above the smoothed moving average, long positions remain valid, with targets at 1.1841 and 1.1902 as part of the broader trend continuation.
Explanations to the Charts:
- Linear regression channels help determine the current trend. If both channels are directed the same way, the trend is strong.
- The moving average line (20,0, smoothed) identifies the short-term trend and the prevailing market direction.
- Murray levels specify target points for movements and potential corrections.
- Volatility levels (red lines) outline the expected price corridor for the next 24 hours, based on recent volatility metrics.
- The CCI indicator, when dropping below -250 or above +250, signals a possible trend reversal in the opposite direction.


