


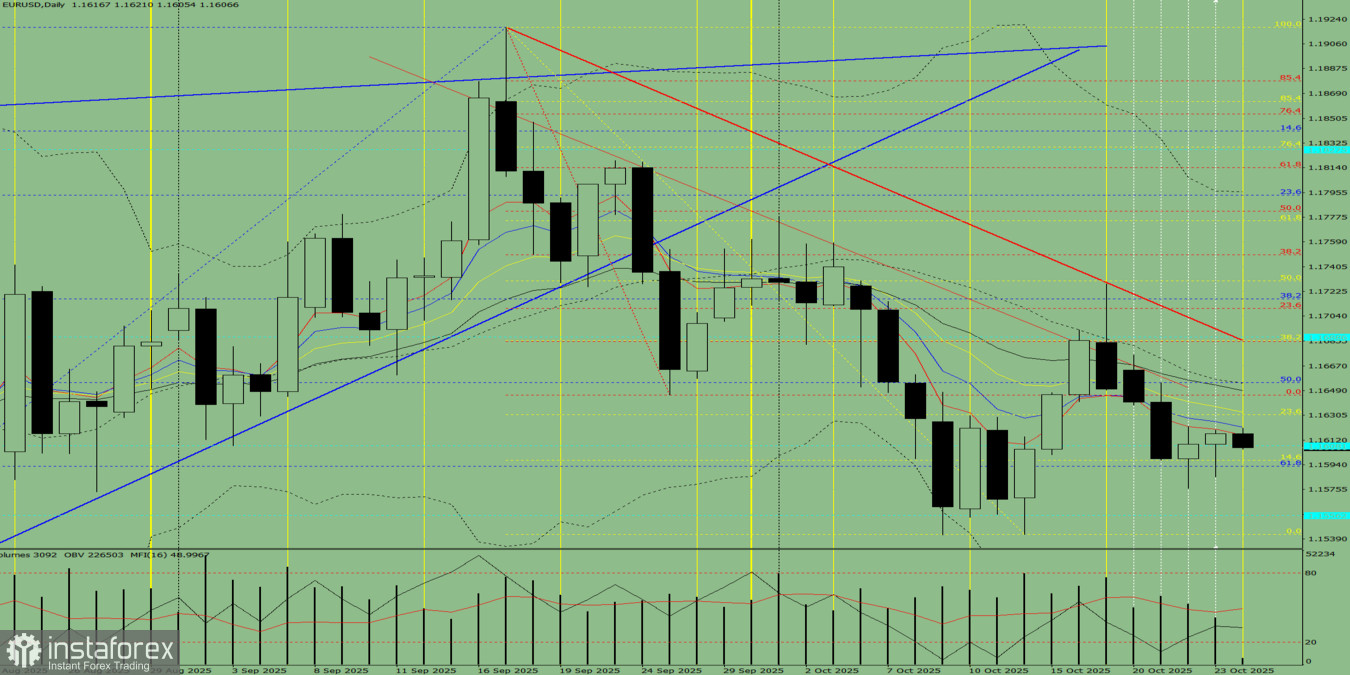
Fig. 1 (Daily Chart)
Comprehensive Analysis:
- Indicator analysis — down
- Fibonacci levels — down
- Volume — down
- Candlestick analysis — down
- Trend analysis — down
- Bollinger Bands — down
- Weekly chart — up
Overall conclusion: Downward trend.
Alternative Scenario:
Today, from the 1.1617 level (yesterday's daily candle close), the price may begin moving downward toward 1.1556 — a historical support level (blue dashed line). When testing this level, a corrective upward price movement is possible, targeting 1.1576 — the lower fractal (daily candle from October 22, 2025).


