


Analysis of Trades and Trading Advice on the Japanese Yen
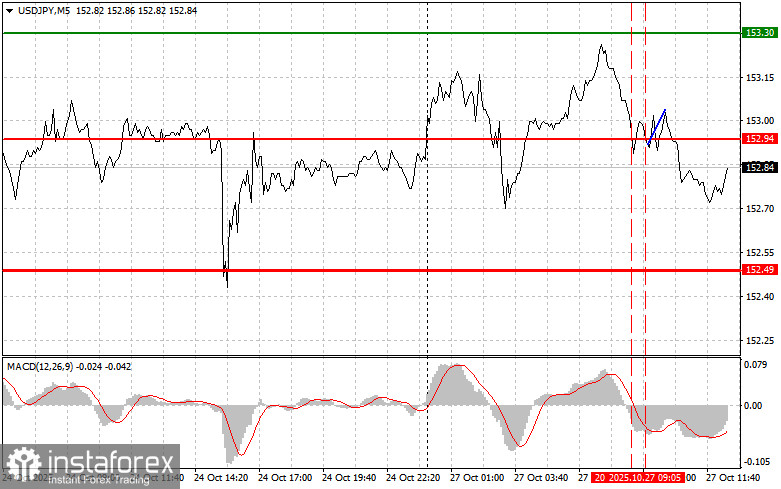
The price test of 152.94 in the first half of the day coincided with a moment when the MACD had already moved far below the zero mark, which limited the pair's downward potential. The second test of this price coincided with the MACD being in the oversold area, which led to the realization of Scenario #2 for buying the pound. Unfortunately, the pair did not experience a significant upward move.
During the U.S. session, traders' attention will shift to the Leading Indicators Index data. A sharp drop in this indicator would lead to a decline in the dollar against the Japanese yen. Although this scenario seems the most likely, it is not the only possible one. A dollar decline against the yen, triggered by weak index data, would represent a minor correction within a bullish market. However, we should not forget the role of the central banks. The Federal Reserve, as the main regulator of the U.S. economy, will likely move to cut interest rates in the coming days. However, the Bank of Japan may also abandon its restrictive stance, keeping traders on the dollar's side.
As for the intraday strategy, I will rely mainly on the implementation of Scenarios #1 and #2.
Buy Signal
Scenario #1: I plan to buy USD/JPY today when the entry point around 152.95 (green line on the chart) is reached, with the target of rising to 153.31 (thicker green line on the chart). Around 153.31, I will exit long positions and open short ones in the opposite direction (expecting a 30–35 point pullback from this level). Further growth of the pair can be expected within the new trend.Important! Before buying, make sure that the MACD indicator is above the zero line and just starting to rise from it.
Scenario #2: I also plan to buy USD/JPY today if there are two consecutive tests of the 152.71 price level, at a time when the MACD is in the oversold area. This will limit the pair's downward potential and lead to a market reversal upward. Growth can be expected toward the opposite levels of 152.95 and 153.31.
Sell Signal
Scenario #1: I plan to sell USD/JPY today after the 152.71 level (red line on the chart) is broken, which will lead to a quick decline in the pair. The key target for sellers will be 152.37, where I will exit short positions and immediately open long ones in the opposite direction (expecting a 20–25 point rebound from this level). Downward pressure on the pair is unlikely to return today.Important! Before selling, make sure that the MACD indicator is below the zero line and just beginning to decline from it.
Scenario #2: I also plan to sell USD/JPY today in case of two consecutive tests of the 152.95 price level, when the MACD is in the overbought area. This will limit the pair's upward potential and lead to a market reversal downward. A decline can be expected toward the opposite levels of 152.71 and 152.37.
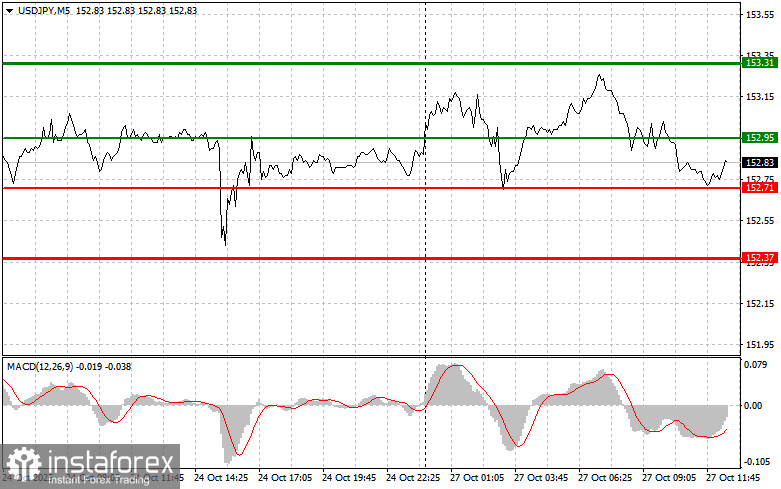
Chart Legend:
- Thin green line – entry price where the instrument can be bought
- Thick green line – target price for setting Take Profit or manually fixing profit, as further growth above this level is unlikely
- Thin red line – entry price where the instrument can be sold
- Thick red line – target price for setting Take Profit or manually fixing profit, as further decline below this level is unlikely
- MACD indicator – when entering the market, it is important to consider overbought and oversold zones
Important Notice
Beginner Forex traders should be extremely cautious when making market entry decisions. Before the release of major fundamental reports, it's best to stay out of the market to avoid sharp price fluctuations. If you decide to trade during news releases, always set stop-loss orders to minimize losses. Without stop-losses, you can quickly lose your entire deposit, especially if you ignore money management and trade with large volumes.
Remember, successful trading requires a clear trading plan, like the one presented above. Spontaneous decisions based on current market conditions are a losing strategy for intraday traders from the very beginning.


