


The EUR/USD currency pair traded higher throughout Monday... We intentionally placed ellipses before the phrase "higher." Why? For the last four weeks, the market has been solely focused on ignoring the fundamental background. During this time, an enormous amount of significant information has become available to traders, not to mention unpublished macroeconomic statistics regarding the labor market and unemployment in the U.S. Trump has been introducing new tariffs and sanctions in bulk, threatening China, India, and Russia; a government shutdown has begun and continues; the third "No Kings" protest against Trump's policies took place in U.S. cities. Moreover, the Federal Reserve is moving closer to fulfilling Trump's long-held wish to lower the key interest rate multiple times. None of these factors prevented the U.S. dollar from growing. It has been growing slowly and weakly, but it was still rising when a decline would have been much more logical.
So, what happened on Monday? On Monday, it was announced that Beijing and Washington discussed the most contentious issues in their relationship and reached an agreement. Thus, on Monday, when the tension surrounding trade relations between the two largest economies in the world was effectively lifted, the dollar fell... And that's all you need to know about the logic and patterns of movements in the EUR/USD pair over the past month. Well, we honestly don't care when exactly the dollar will begin its new prolonged decline. We fully understand that the market is driven by major players—market makers. Building new large positions worth billions of dollars takes time. While these positions are being formed, we see a flat on the charts.
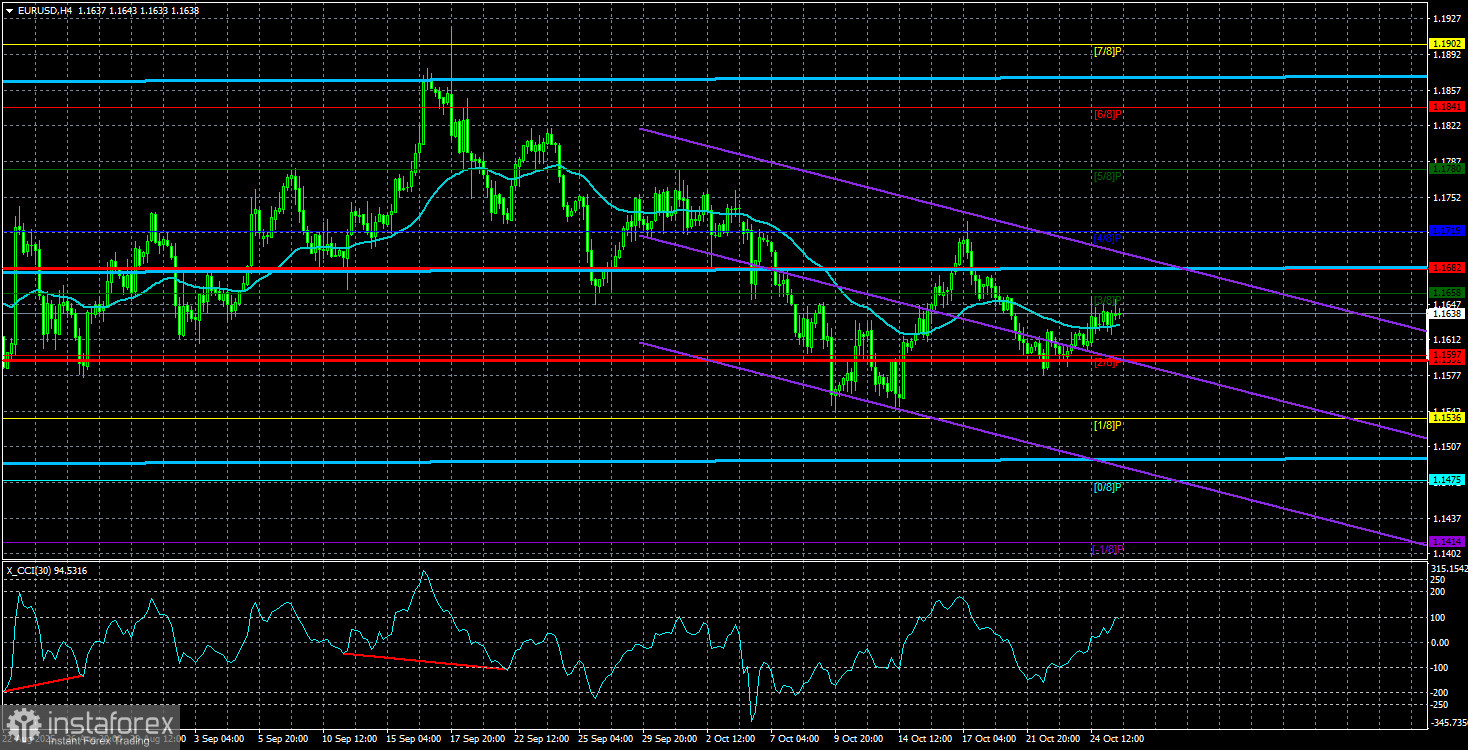
To see a flat on these charts does not require much effort. We have been drawing readers' attention to the daily timeframe for several weeks now. The pair has traded within the range of 1.1400-1.1830 since July 1 of this year. This means it has been nearly four months. During this period, it attempted to break out of the channel only once, unsuccessfully.
Thus, the illogical downward movement over the last few weeks can be easily explained – it's an intra-flat random movement. While major capital is forming the necessary positions, the market sees a flat, but the flat would not be possible if the market continued to process macroeconomic and fundamental information (as we mentioned, over the past four months, there have been plenty of factors for a new decline in the American currency). But positions have not yet been formed, which is why the dollar is not falling, even though it should.
So, what to do with all this information? From our point of view, the same thing that major capital is doing now. Forming positions and waiting for a trend movement to begin. Of course, a new upward trend cannot be guaranteed by anyone or anything, but given all the factors (not selectively), we believe the "2025 trend" will continue.
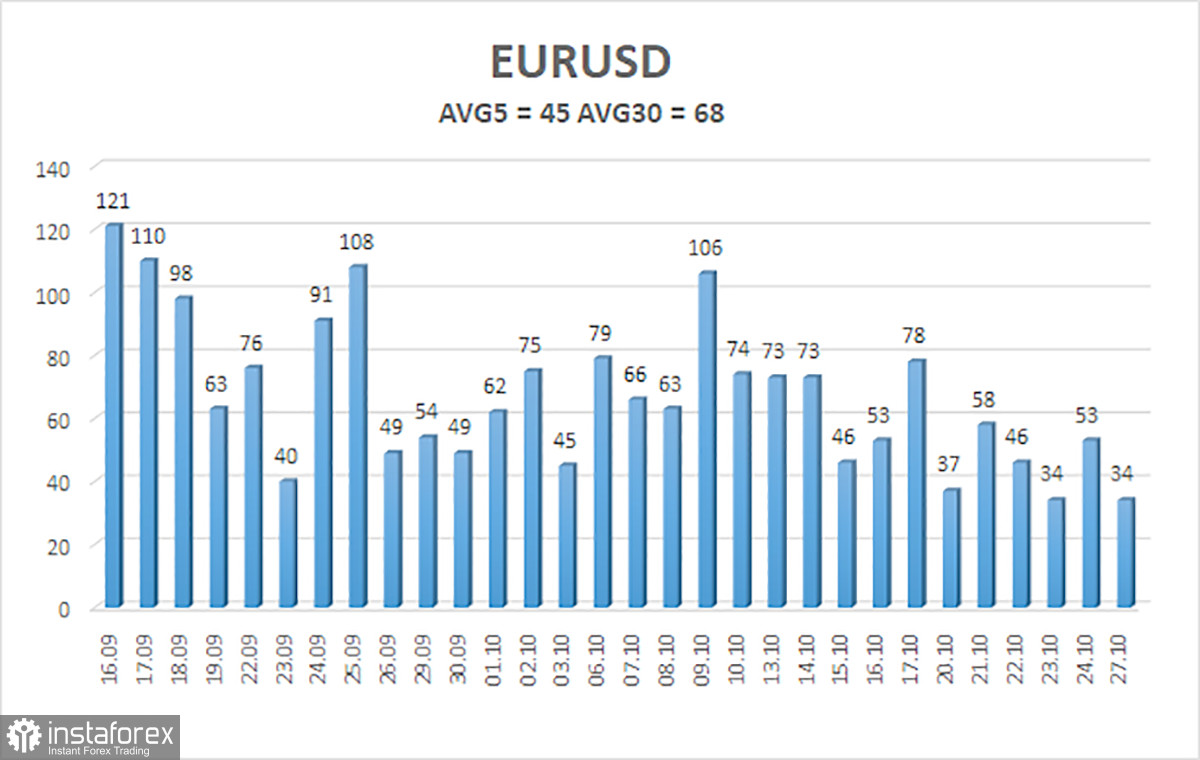
The average volatility of the EUR/USD currency pair over the last five trading days as of October 28 is 45 pips and is characterized as "low." We expect the pair to trade between 1.1592 and 1.1682 on Tuesday. The upper linear regression channel points upward, indicating an upward trend. The CCI indicator has entered the oversold area, which may provoke a new round of upward trend.
Nearest Support Levels:
- S1 – 1.1597
- S2 – 1.1536
- S3 – 1.1475
Nearest Resistance Levels:
- R1 – 1.1658
- R2 – 1.1719
- R3 – 1.1780
Trading Recommendations:
The EUR/USD pair is attempting to start a new upward trend on the 4-hour timeframe; the trend is also present on all higher timeframes, but the daily timeframe has been flat for several months. The U.S. dollar continues to be heavily influenced by Donald Trump's policies, which he does not intend to "stop at what has been achieved." Recently, the dollar has risen, but local reasons are at least ambiguous. However, the flat on the daily timeframe explains everything. With the price situated below the moving average, one may consider small shorts with targets at 1.1592 and 1.1536 purely on technical grounds. Above the moving average, long positions remain relevant with targets at 1.1841 and 1.1902 to continue the trend.
Explanations for the Illustrations:
- Linear regression channels help identify the current trend. If both are directed in the same direction, it indicates a strong trend.
- The moving average line (settings: 20.0, smoothed) determines the short-term trend and the direction in which trading should currently be conducted.
- Murray levels serve as target levels for movements and corrections.
- Volatility levels (red lines) indicate the probable price channel the pair is likely to trade within over the next 24 hours, based on current volatility indicators.
- The CCI indicator entering the oversold area (below -250) or the overbought area (above +250) indicates that a trend reversal in the opposite direction is imminent.


