


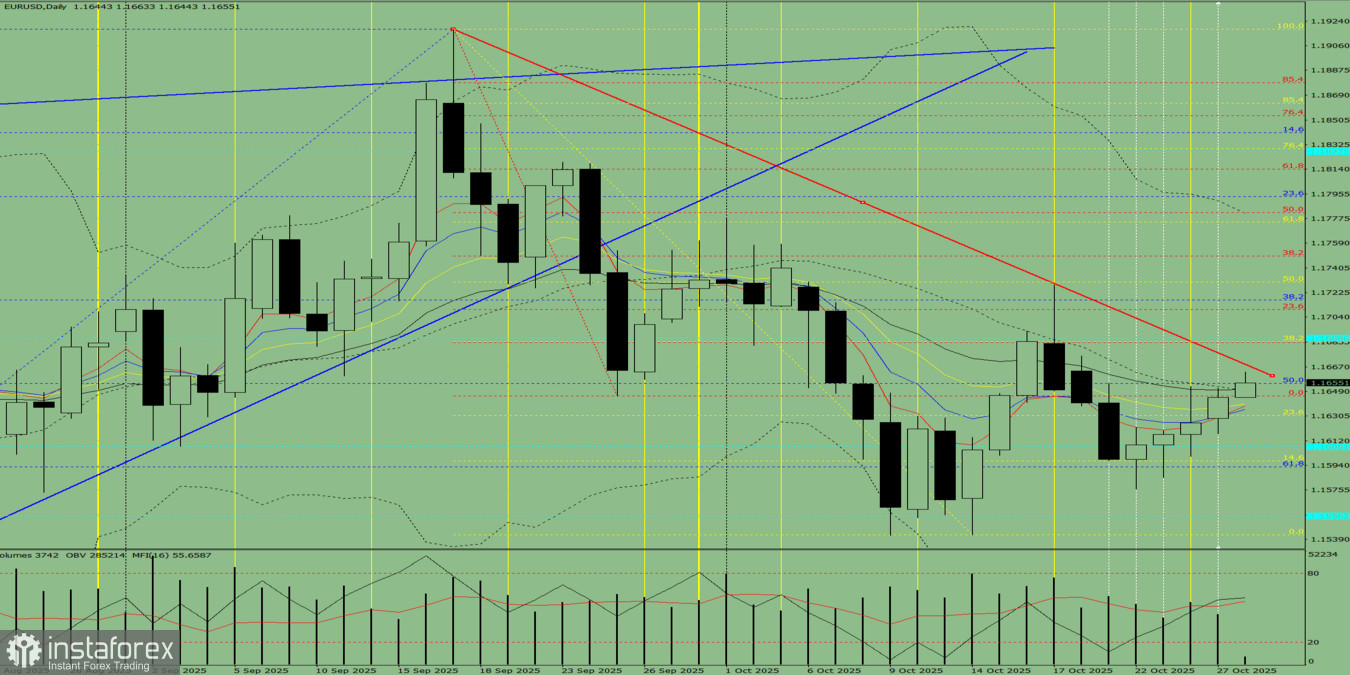
Fig. 1 (Daily Chart).
Comprehensive Analysis:
- Indicator analysis – upward;
- Volume – upward;
- Candlestick analysis – upward;
- Trend analysis – upward;
- Bollinger Bands – upward;
- Weekly chart – upward.
Overall conclusion: Upward trend.
Alternative scenario:From the level of 1.1644 (yesterday's daily candle close), the price may continue moving upward toward 1.1668 — the support line (thick red line). Upon testing this line, the price may pull back downward toward 1.1645 — the upper fractal (red dashed line).


