


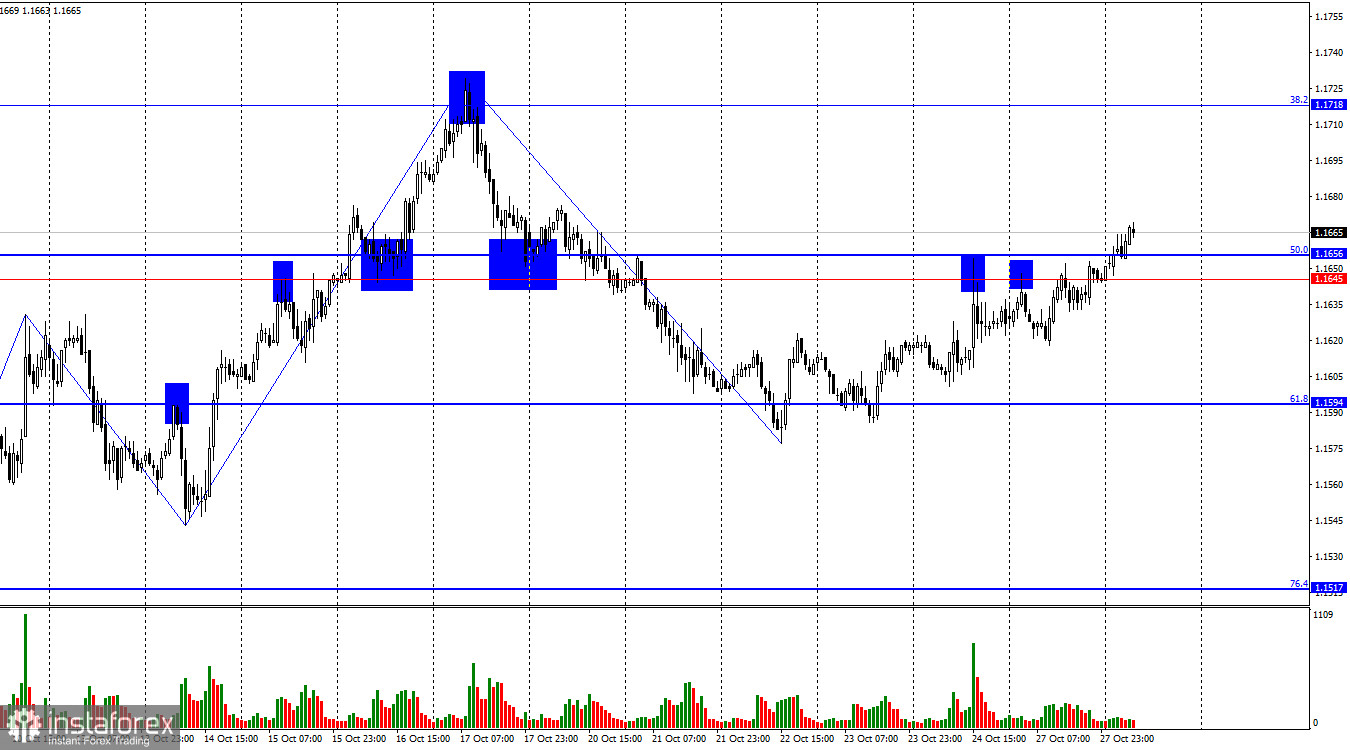
On Monday, the EUR/USD pair consolidated above the resistance level of 1.1645–1.1656, which allows us to expect further growth toward the next corrective level of 38.2% – 1.1718. I remind you that the weekly decline of the European currency did not cancel the bullish trend, so buying remains preferable to selling for me. However, a consolidation of quotes below the 1.1645–1.1656 level would favor the U.S. dollar and trigger a new decline toward the 61.8% corrective level at 1.1594.
The wave situation on the hourly chart remains simple and clear. The last upward wave broke above the previous wave's peak, while the last downward wave did not break the previous low. Thus, the trend is currently bullish. Recent labor market data, the changing outlook for the Fed's monetary policy, Trump's renewed aggression toward China, and the ongoing "shutdown" all support bullish traders. However, the bulls themselves are still attacking sluggishly, as if they simply don't want to for some unknown reason.
On Monday, there was no significant news background, and the only notable updates concerned trade negotiations between China and the United States. Media reports indicated that a planned 100% tariff increase on Chinese goods would not take place, and China decided to postpone for one year the restrictions on the export of rare-earth metals. It's worth recalling that Beijing's earlier decision to tighten control over the export of these rare metals, used in high-tech manufacturing, became the starting point for a new round of U.S.–China conflict. However, negotiations have produced some results. It's still too early to speak of a full truce, but the tension is gradually easing. Unfortunately, the U.S. dollar could not take advantage of this situation. Bearish traders had been attacking for over a week without any support, and now the bulls have gone on the offensive. Therefore, I expect further growth above the 1.1718 level.
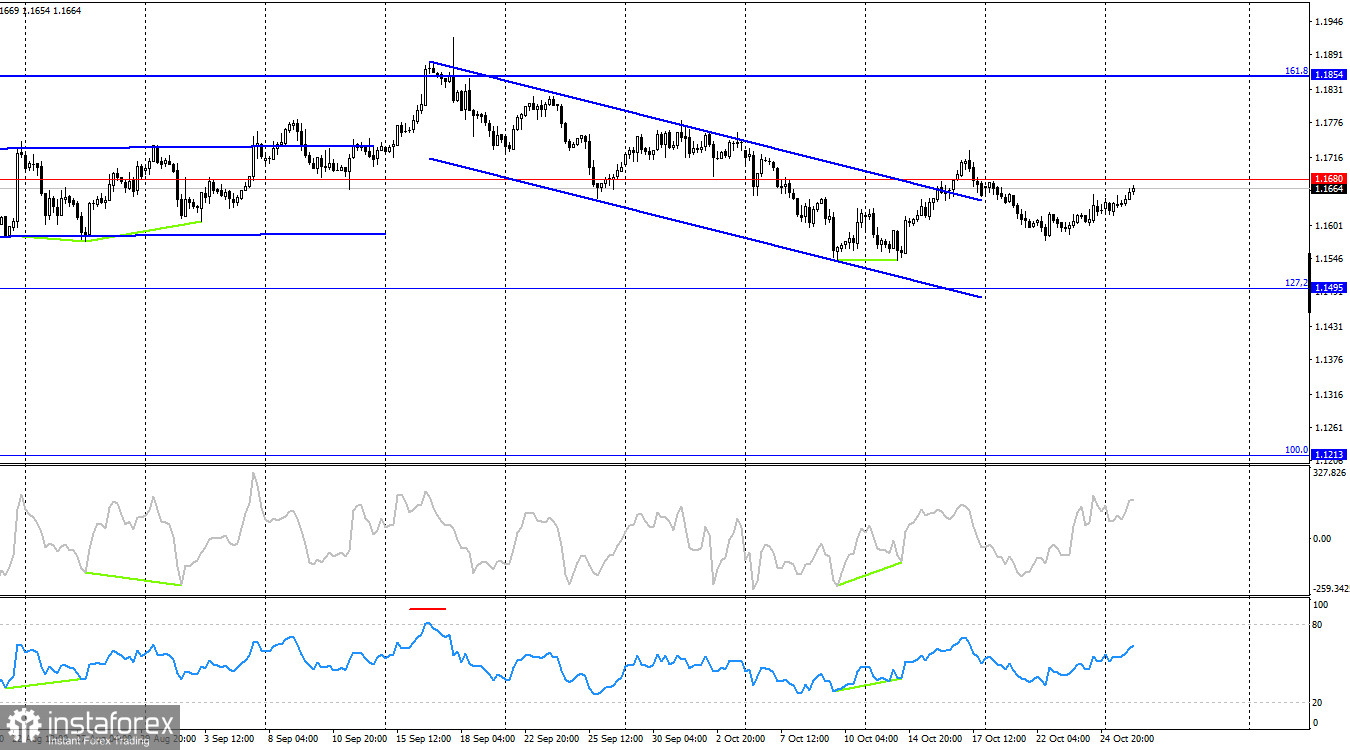
On the 4-hour chart, the pair made a reversal in favor of the U.S. dollar and consolidated below the 1.1680 level, which could lead to some decline. However, earlier there was also a consolidation above the descending trend channel after a bullish divergence appeared on the CCI indicator. Thus, the upward movement may resume toward the next 161.8% corrective level at 1.1854. Market movements are currently very weak, and I believe the hourly chart provides more informative analysis.
Commitments of Traders (COT) Report
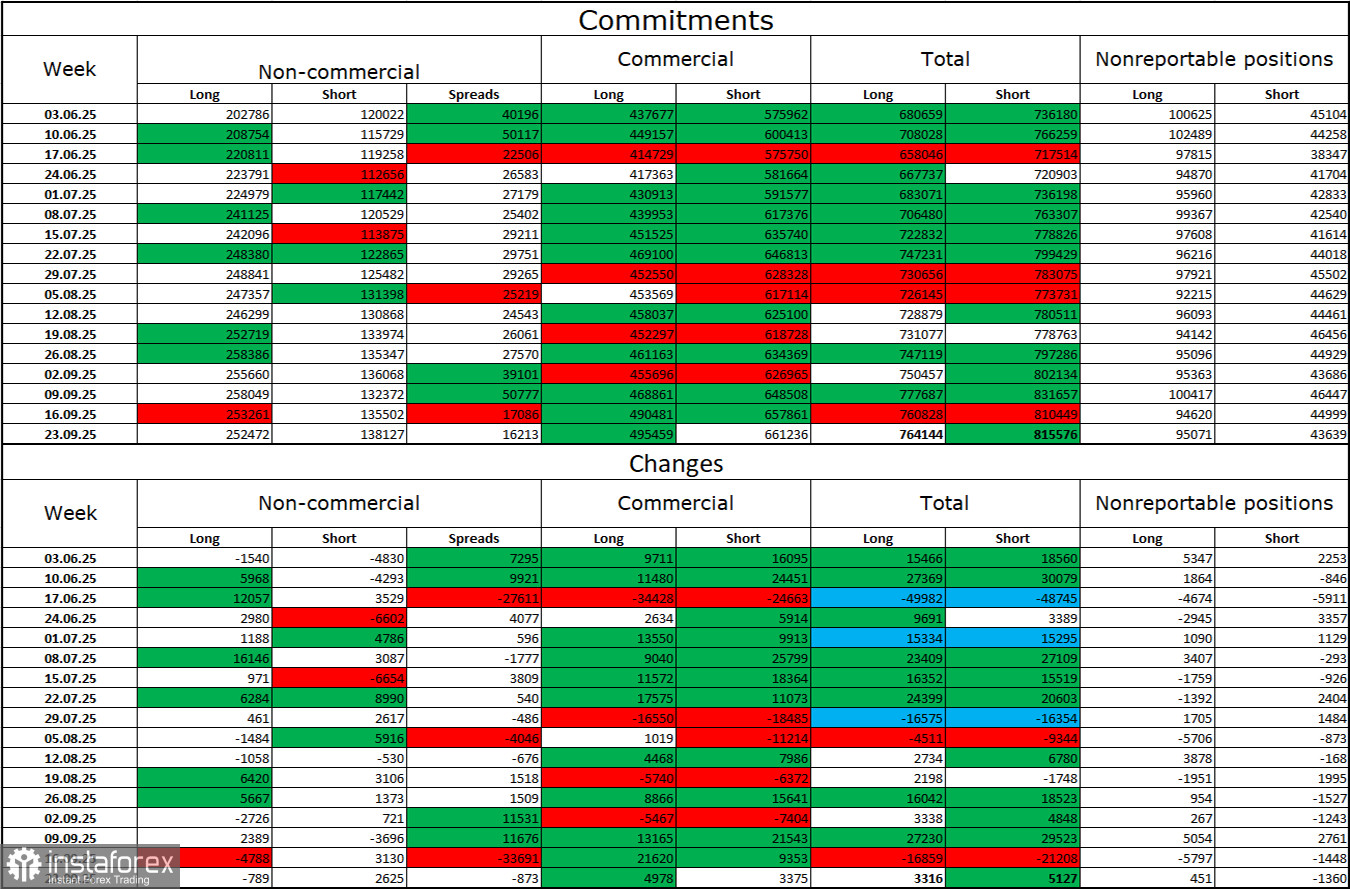
During the last reporting week, professional traders closed 789 long contracts and opened 2,625 short positions. No new COT reports have been released for a month now. The sentiment of the "Non-commercial" group remains bullish thanks to Donald Trump, and it continues to strengthen over time. The total number of long positions held by speculators is now 252,000, while short positions total 138,000 — a nearly twofold difference. In addition, note the number of green cells in the table above, which show a strong increase in positions on the euro. In most cases, interest in the euro continues to grow, while interest in the dollar declines.
For thirty-three consecutive weeks, major players have been reducing short positions and increasing longs. Donald Trump's policies remain the most significant factor for traders, as they could cause many problems of a long-term and structural nature for the U.S. economy. Despite the signing of several important trade agreements, many key economic indicators continue to show declines.
News Calendar for the U.S. and the Eurozone
Eurozone: Consumer Confidence Index in Germany (07:00 UTC).
On October 28, the economic calendar contains only one entry, which is not of any particular interest. The information background will have no impact on market sentiment on Tuesday.
Forecast for EUR/USD and Trading Advice
Sales are possible today if the price closes below the 1.1645–1.1656 level on the hourly chart, with a target of 1.1594. Purchases could be considered after a close above the 1.1645–1.1656 zone, with a target of 1.1718. These trades can be kept open today in anticipation of continued growth.
Fibonacci grids are built from 1.1392–1.1919 on the hourly chart and from 1.1214–1.0179 on the 4-hour chart.


