


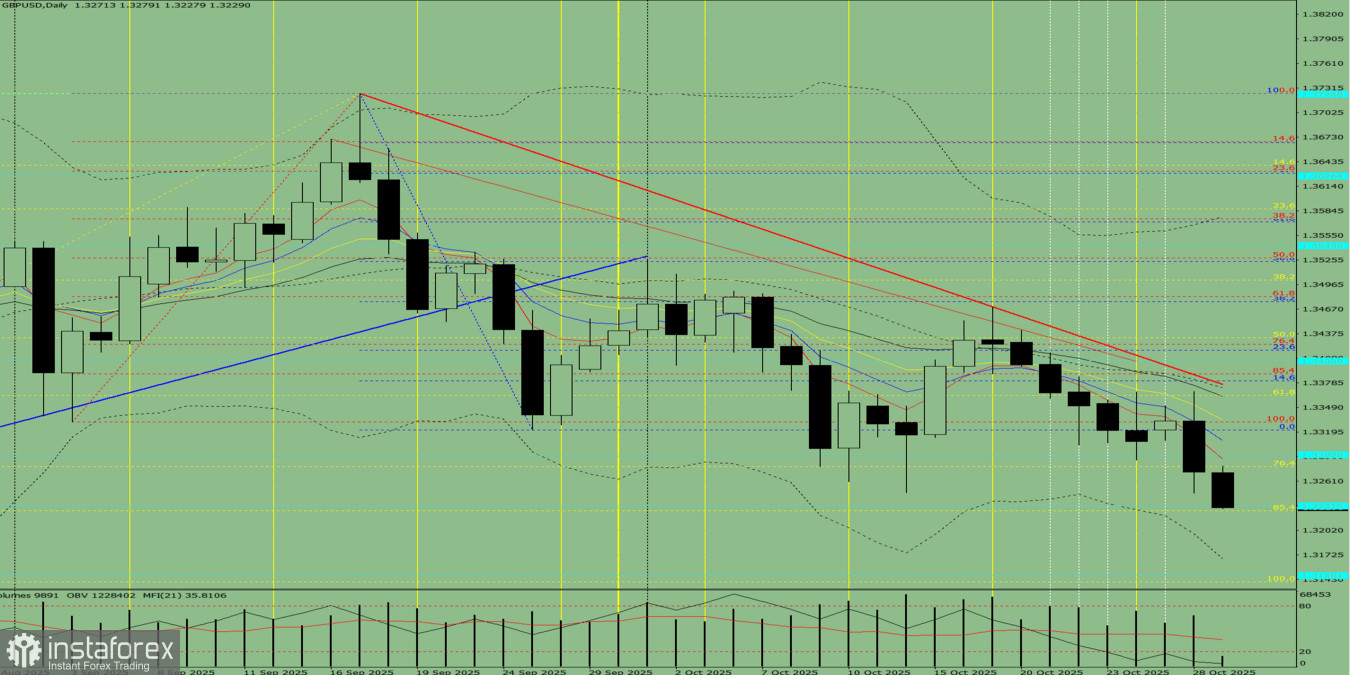
Fig. 1 (Daily Chart)
Comprehensive Analysis:
- Indicator analysis – down;
- Fibonacci levels – down;
- Volumes – down;
- Candlestick analysis – down;
- Trend analysis – down;
- Bollinger Bands – down;
- Weekly chart – down.
Overall conclusion: downward trend.
Alternative Scenario:
On Wednesday, the market may possibly continue moving downward from the level of 1.3271 (yesterday's daily candle close), targeting 1.3148 – a historical support level (blue dashed line). Upon testing this level, the price may rebound upward toward 1.3225 – the 85.4% retracement level (yellow dashed line).


