


The EUR/USD currency pair traded for most of Wednesday in a familiar fashion—characterized by minimal volatility and a complete lack of trend. Trading conditions in recent weeks have been far from ideal. First, the market is ignoring a plethora of factors, nearly all of which are against the dollar. Second, we have been experiencing a flat condition on the daily timeframe for several months. Third, due to the US "shutdown," the market currently lacks macroeconomic data related to the labor market and unemployment. Fourth, there is a general reluctance to engage in active trading, as shown in the illustration below.
Thus, a single event clearly cannot rectify the situation. As is our tradition, we will not discuss the outcomes of the FOMC meeting in this article, as we believe it should take at least a day after such an event for all market participants to fully digest what has been said and seen. It often happens that during the release of results (which are primarily known in advance) or during Jerome Powell's speech, the market trades impulsively and emotionally. The price can soar upward at lightning speed, only to return to its original position within 10-15 hours. Therefore, we believe it is necessary to allow time before making definitive conclusions about the Federal Reserve's monetary policy and the market's reaction.
The dollar's position remains unenviable regardless of the Fed's decision. If the Fed cuts the key rate, it's a "bearish" factor for the dollar. If the Fed does not cut the key rate, the dollar will still have a multitude of other factors working against it. We continue to believe that the ongoing flat on the daily timeframe is key in the current narrative, as a flat formation does not afford good movements regardless of any fundamental or macroeconomic events.
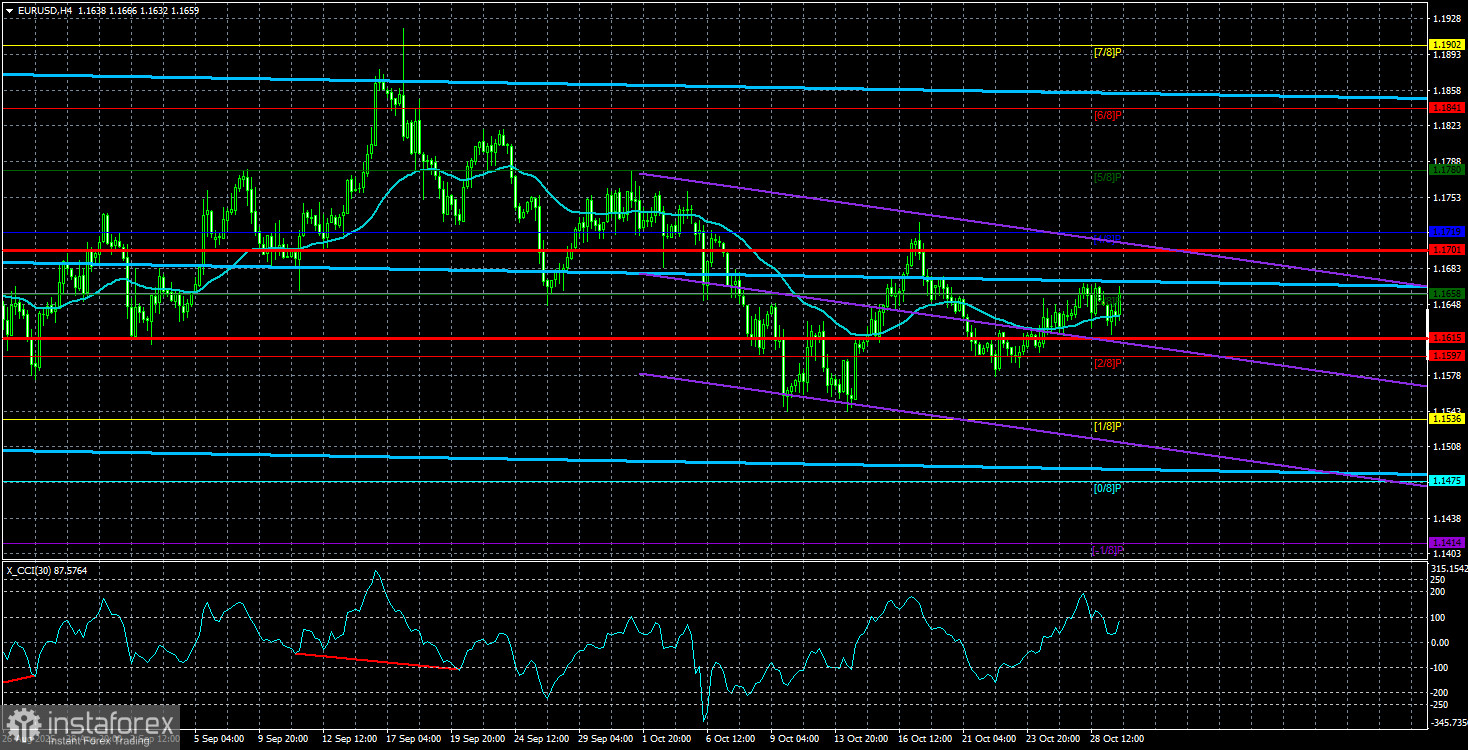
Additionally, this flat is not a local one (lasting a couple of weeks), which might have ended under the influence of such a significant fundamental event as the FOMC meeting. This flat has been global and has persisted since July 1. Just hours before the FOMC results were announced, the price was positioned exactly in the middle of the sideways channel between 1.1400 and 1.1830. Consequently, a very strong movement would be necessary to end this flat abruptly.
In summary, we can state that under any Fed policy, we do not expect medium-term strengthening of the US currency. In recent weeks, the British pound has also been falling sharply, but even this movement appears very dubious and does not negate the ongoing flat. Thus, if we are discussing logical and rational movements, we cannot forecast a rise in the dollar. It is unlikely that we will be able to do so in the coming months. We also want to remind you that the US "shutdown" has been ongoing for a month and is not causing any discomfort for the dollar, which is itself strange.
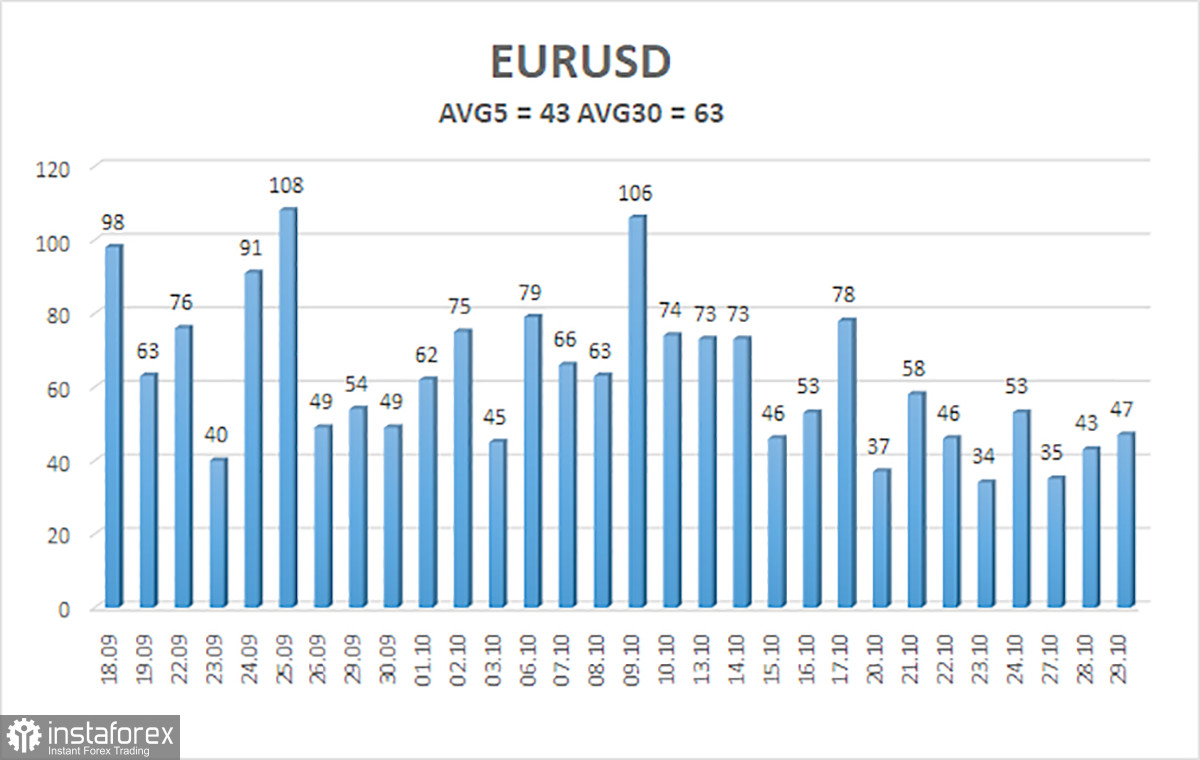
The average volatility of the EUR/USD currency pair over the past five trading days, as of October 30, is 43 pips and is characterized as "low." We anticipate movement in the pair between 1.1615 and 1.1701 on Thursday. The upper channel of linear regression is oriented upward, still indicating an upward trend. The CCI indicator has entered the oversold area, which may provoke a new phase of upward trend.
Nearest Support Levels:
- S1 – 1.1597
- S2 – 1.1536
- S3 – 1.1475
Nearest Resistance Levels:
- R1 – 1.1658
- R2 – 1.1719
- R3 – 1.1780
Trading Recommendations
The EUR/USD pair is making attempts to start a new upward trend on the 4-hour timeframe. Across all higher timeframes, the upward trend remains, but the daily timeframe has been flat for several months. Donald Trump's policies continue to exert a strong influence on the dollar, as he does not intend to "rest on his laurels." Recently, the dollar has risen, but the local reasons are at least ambiguous. However, the flat on the daily timeframe explains everything. With the price positioned below the moving average, small short positions can be considered with targets at 1.1597 and 1.1536 based solely on technical grounds. Long positions remain relevant above the moving average with targets at 1.1841 and 1.1902, continuing the trend.
Explanations for the Illustrations:
- Linear Regression Channels: Help determine the current trend. If both are pointing in the same direction, the trend is strong.
- Moving Average Line (settings 20.0, smoothed): Determines the short-term trend and the direction in which trading should currently be conducted.
- Murray Levels: Target levels for movements and corrections.
- Volatility Levels (red lines): Likely price channel in which the pair will move over the next day based on current volatility metrics.
- CCI Indicator: Its entry into the oversold area (below -250) or the overbought area (above +250) indicates that a trend reversal in the opposite direction is imminent.


