


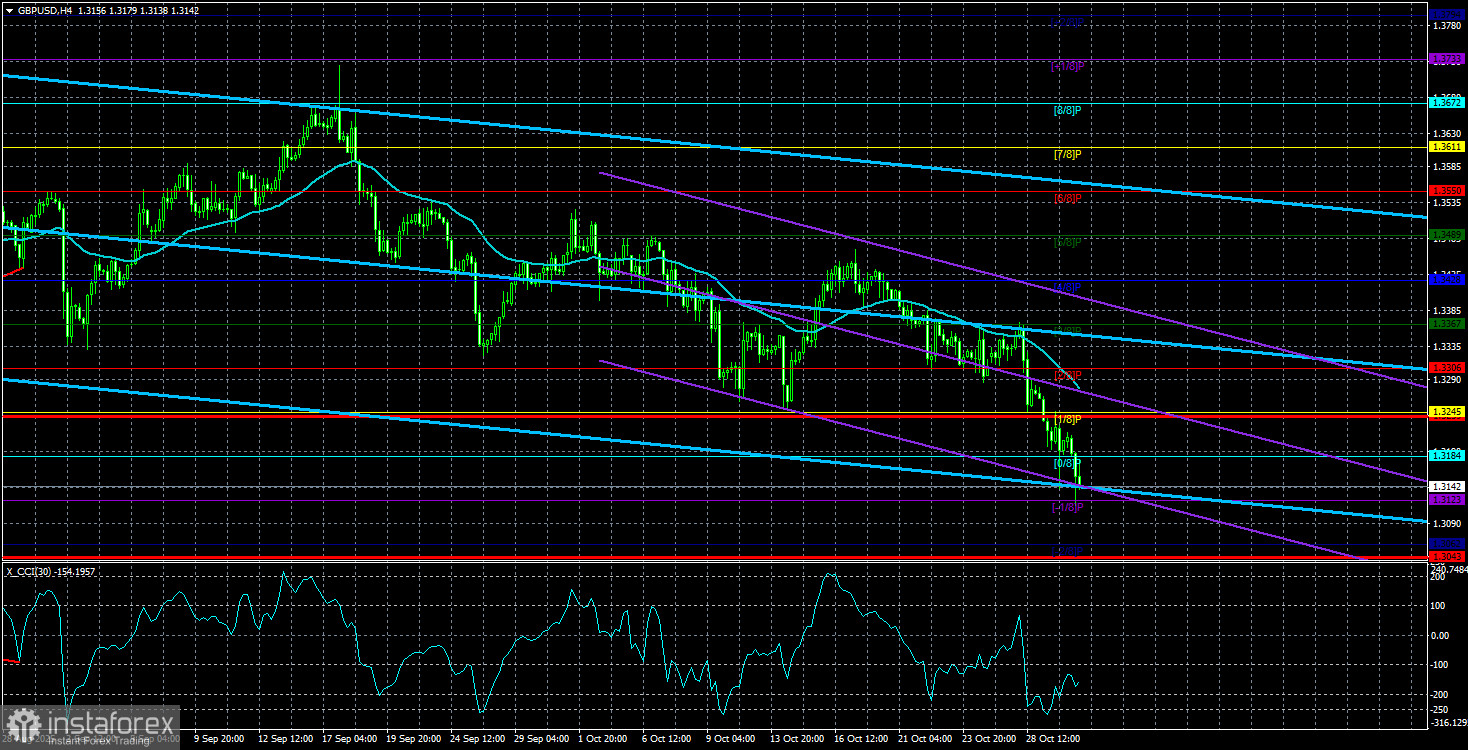
The GBP/USD currency pair continued its downward movement on Tuesday, Wednesday, and Thursday, and it has approached the Fibonacci 38.2% level on the daily timeframe. This level is corrective for the entire upward trend of 2025. In simple terms, the pound sterling has now corrected by 38.2% for the second time after a rise of 1700 pips. The British pound is now in a rather precarious position, as a confident break of the level at 1.3141 would indicate that the correction is continuing. We still believe that there are no fundamental or macroeconomic grounds for the US dollar to strengthen, but there haven't been any for October either (with rare exceptions). However, we see that the American currency is confidently rising.
One could assume the following. Those who read our daily cryptocurrency reviews are familiar with the term "liquidity removal." Therefore, we do not rule out that liquidity could be stripped from the last local low on the daily timeframe, which would serve as a starting point for a new round of the upward trend. Of course, this is just an assumption, but it is a valid one.
More than a day has passed since the conclusion of the FOMC meeting, so we can draw some initial conclusions. The Federal Reserve cut the key rate by 0.25% as expected; it announced the end of the asset reduction cycle starting December 1 (ending the QE program); and Jerome Powell indicated that a rate cut in December is not guaranteed. Judging by the market's reaction, it has already set new forecasts regarding how the Fed will act in the coming months. From our point of view, Powell consistently provides the market with all necessary information.
What exactly did Powell say? The same as before: decisions will be made only based on macroeconomic data, many of which are currently lacking due to the "shutdown." The Fed Chair explained that the decision to lower the rate in October was a preventative measure aimed at balancing risks. In other words, the FOMC decided to lower the rate almost blindly, without understanding the current state of the labor market, but assuming it was in poor condition.
Thus, the decision at the December meeting will also be made based on incoming macroeconomic data. If, by then, the "shutdown" (which so far does not concern the dollar) is resolved, the Fed will have a full range of data on which to base its decision. If the "shutdown" continues (and given Trump, that's quite possible), there may not be a second preventative step. Jerome Powell made it clear to the market that he does not know what the central bank's decision will be in December, but traders have once again set various forecasts that they continue to actively work through. The market now doubts a December cut, even though just the day before yesterday, there was confidence in it. The pound continues to fall, and if it does not reverse its course soon, it risks dropping much lower than its current levels.
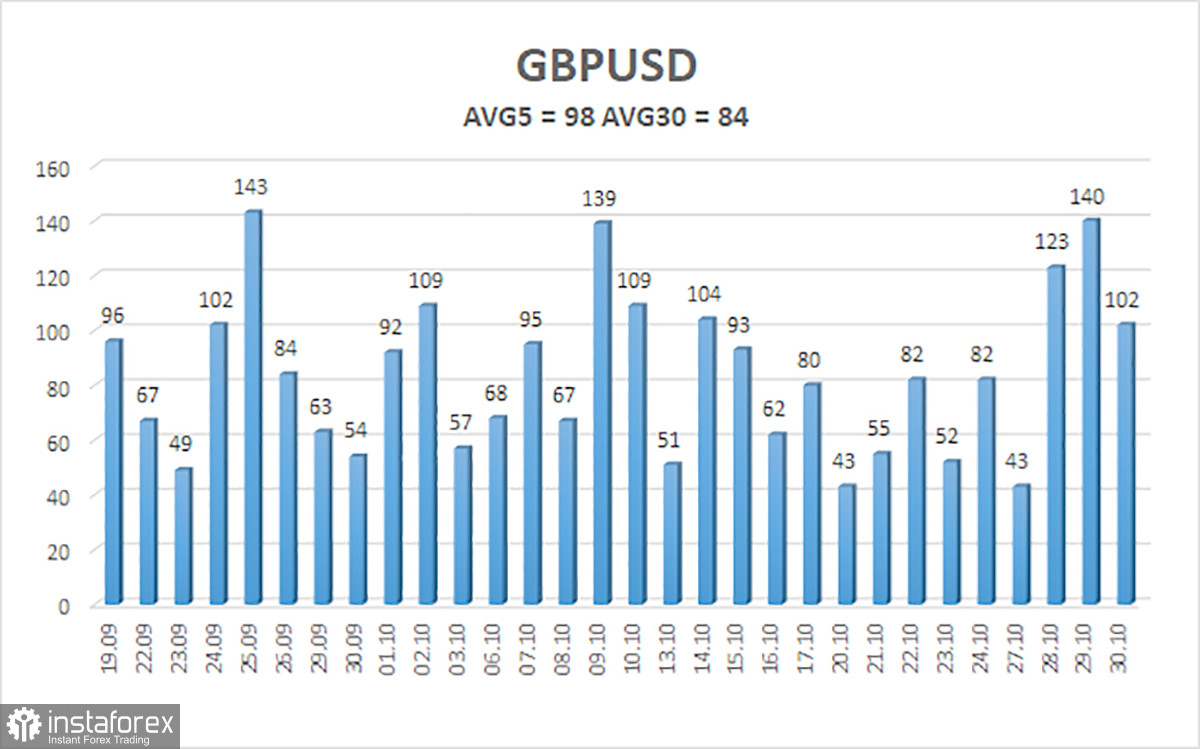
The average volatility of the GBP/USD pair over the last five trading days as of October 31 is 98 pips, which is considered "average." On Friday, we expect movement within the range of 1.3043 to 1.3239. The upper channel of the linear regression is upward, indicating a clear upward trend. The CCI indicator has entered oversold territory four times, suggesting a potential resumption of the upward trend.
Nearest Support Levels:
- S1 – 1.3123
- S2 – 1.3062
Nearest Resistance Levels:
- R1 – 1.3184
- R2 – 1.3245
- R3 – 1.3306
Trading Recommendations:
The GBP/USD pair is trying to resume its 2025 upward trend, and its long-term prospects remain unchanged. Donald Trump's policies will continue to exert pressure on the dollar, which is why we do not expect the dollar to appreciate. Currently, the flat state on the daily timeframe is still in play. Therefore, long positions with targets at 1.3672 and 1.3733 remain much more relevant while the price is above the moving average. The price's position below the moving average suggests considering small short positions with targets at 1.3062 and 1.3043 on technical grounds. Occasionally, the US currency shows corrections, but for the trend to strengthen, it needs real signs of the end of the trade war or other global positive factors.
Explanations for the Illustrations:
- Support and Resistance Levels: Thick red lines where movement may end; they do not provide trading signals.
- Kijun-sen and Senkou Span B Lines: Ichimoku indicator lines transferred to the hourly timeframe from the 4-hour. They are strong lines.
- Extreme Levels: Thin red lines where the price previously bounced; these are sources of trading signals.
- Yellow Lines: Trend lines, trend channels, and any other technical patterns.
- Indicator 1 on COT Charts: The size of the net position for each category of traders.


