


Trade Analysis of Friday:
1H Chart of the EUR/USD Pair
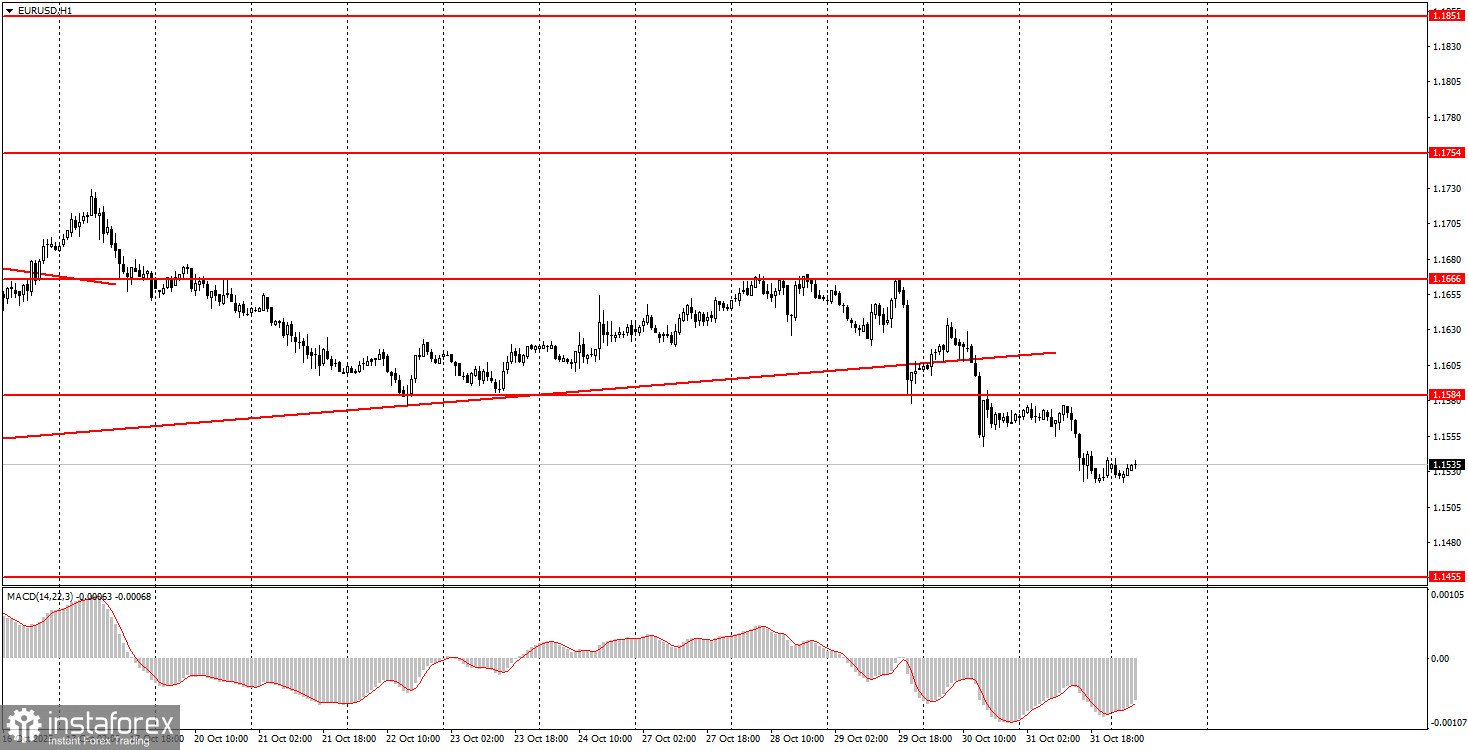
The EUR/USD currency pair continued its downward movement on Friday for somewhat dubious reasons. On the last trading day of the week, the only event that might have interested novice traders was the Eurozone inflation report. Recall that inflation reports in the EU are released in two estimates, with the first being the most important. On Friday, the first estimate for October was released, showing a year-on-year rate of 2.1%, in line with analysts' forecasts. Thus, there was essentially nothing to react to, and there were no grounds for the euro to fall again. Setting aside the comparison of forecast versus reality, let's focus on the fact of slowing inflation. A decline in inflation formally indicates an increase in the European Central Bank's "dovish" stance and moves it closer to lowering the key interest rate. However, in this case, the decline in inflation is too insignificant, and the ECB will be ready to intervene only if the figure falls below 2%. Therefore, Friday's inflation report did not impact the ECB's monetary plans. The European currency continues to decline on technical grounds.
5M Chart of the EUR/USD Pair
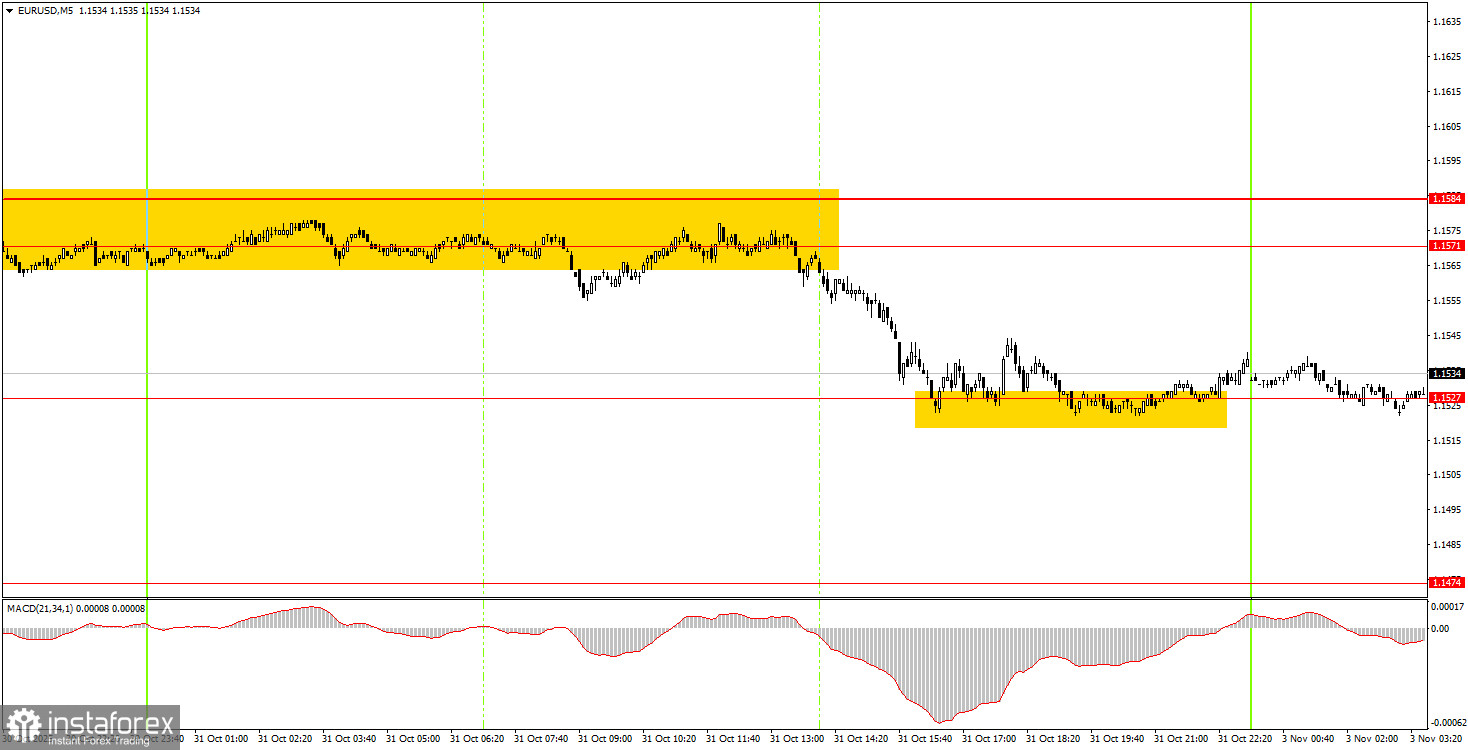
On the 5-minute timeframe, one sell trading signal was generated throughout Friday, which consolidated for almost the entire day. At the start of the American trading session, the price broke out of the 1.1571-1.1584 area, allowing short positions to be opened. Within just a few hours, the EUR/USD pair dropped to the nearest target of 1.1527 and bounced off it. Therefore, novice traders had an excellent opportunity to secure profits. Volatility on Friday was again low, resulting in modest profits.
How to Trade on Monday:
On the hourly timeframe, the EUR/USD pair again shows a desire to continue falling. A new ascending trend line has been breached, and the overall fundamental and macroeconomic background remains lacking for the US dollar. Thus, the European currency may continue to decline on technical grounds. However, the flat trend on the daily timeframe remains significant, so we anticipate its conclusion and the resumption of an upward trend.
On Monday, novice traders may trade at the 1.1527 level. A bounce from this level is a reason to open long positions targeting 1.1571-1.1584. Stability below this level opens the door for shorts targeting 1.1474.
On the 5-minute timeframe, traders should consider the following levels: 1.1354-1.1363, 1.1413, 1.1455-1.1474, 1.1527, 1.1571-1.1584, 1.1655-1.1666, 1.1745-1.1754, 1.1808, 1.1851, 1.1908, 1.1970-1.1988. On Monday, business activity indices are scheduled for publication in the Eurozone, Germany, and the US, with particular attention on the ISM index, which we expect to elicit a strong market reaction.
Basic Rules of the Trading System:
- The strength of a signal is determined by the time it took to form (bounce or breach a level). The less time needed, the stronger the signal.
- If two or more trades based on false signals are opened around any level, all subsequent signals from that level should be ignored.
- In a flat market, any pair can generate numerous false signals or none at all. In any case, it's best to stop trading at the first signs of a flat market.
- Trades should be opened during the timeframe between the start of the European session and halfway through the American session; all trades must then be manually closed.
- On the hourly timeframe, signals from the MACD indicator should ideally be traded only in the presence of good volatility and a trend confirmed by a trendline or trend channel.
- If two levels are too close to each other (between 5 and 20 pips), they should be regarded as a support or resistance area.
- After the price moves 15 pips in the right direction, a Stop Loss should be set to break even.
What to Look at on the Charts:
- Support and resistance price levels are targets for opening buy or sell positions. Take profit levels can be placed near them.
- Red lines indicate channels or trend lines that show the current trend and suggest the preferred direction of trade.
- The MACD indicator (14,22,3) provides a histogram and signal line, serving as an auxiliary indicator that can also be used as a source of signals.
Important statements and reports (always found in the news calendar) can significantly influence the movement of the currency pair. Therefore, during their release, traders should proceed with maximum caution or exit the market to avoid sudden price reversals against the preceding movement.
Beginners trading in the Forex market should remember that not every trade can be profitable. Developing a clear strategy and practicing sound money management are key to long-term trading success.


