


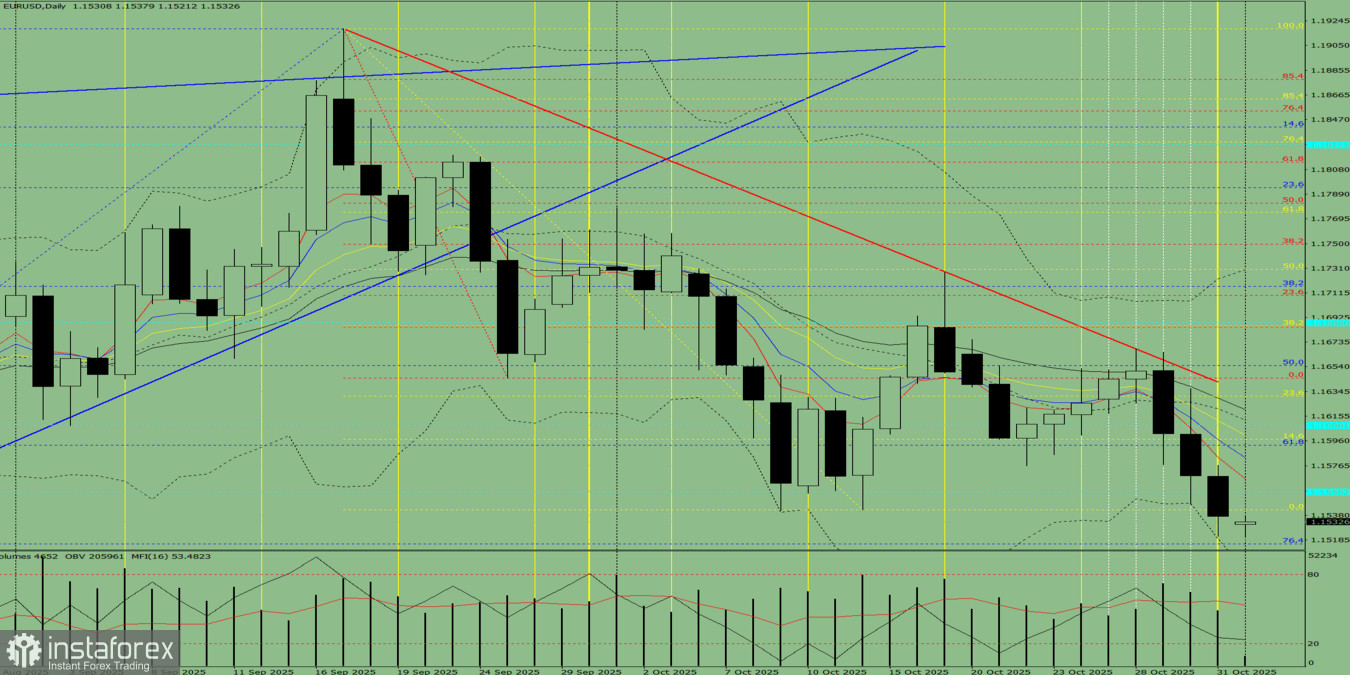
Fig. 1 (Daily Chart).
Comprehensive Analysis:
- Indicator analysis – upward;
- Fibonacci levels – upward;
- Volumes – upward;
- Candlestick analysis – upward;
- Trend analysis – upward;
- Bollinger Bands – upward;
- Weekly chart – upward.
Overall conclusion: Upward trend.
Alternative scenario:From the level 1.1537 (Friday's daily candle close), the price may continue moving downward toward the 1.1515 level – the 76.4% retracement level (blue dashed line). Upon reaching this level, a corrective upward movement toward 1.1556 – the historical resistance level (light blue dashed line) – is possible.


