


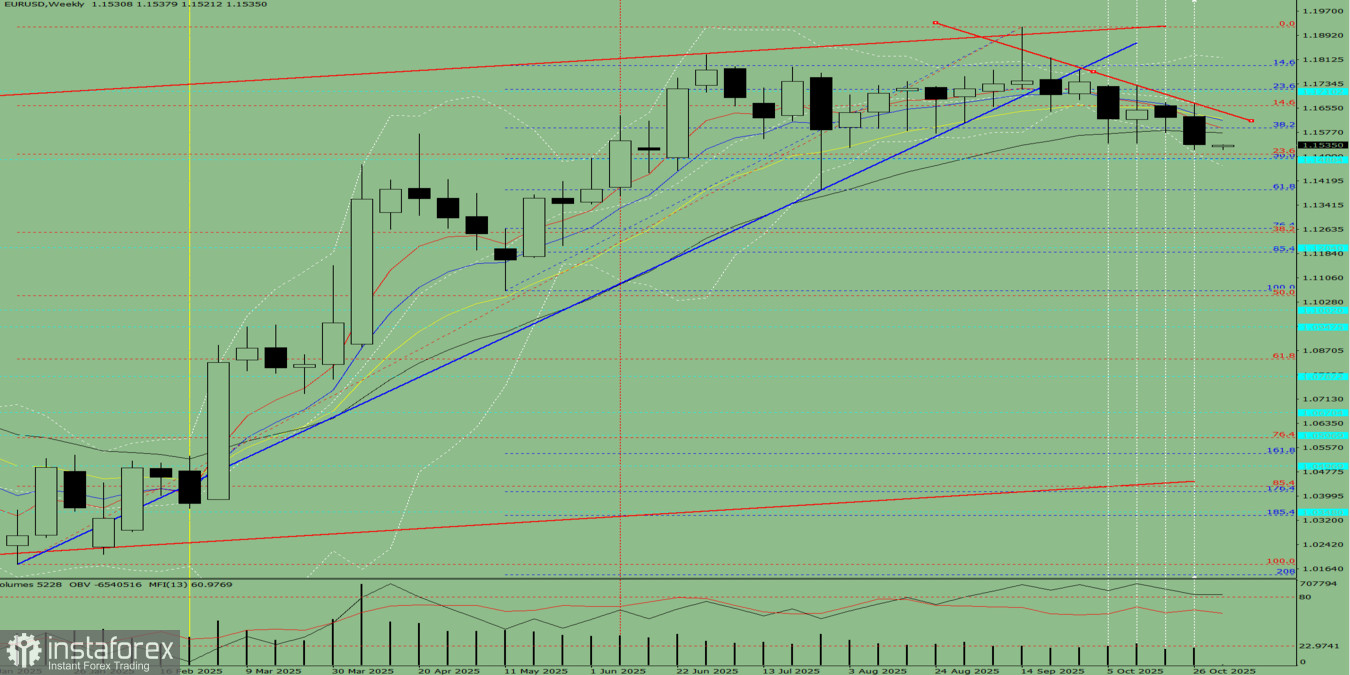
Fig. 1 (Weekly Chart).
Comprehensive Analysis:
- Indicator analysis – downward;
- Fibonacci levels – downward;
- Volumes – downward;
- Candlestick analysis – downward;
- Trend analysis – downward;
- Bollinger Bands – downward;
- Monthly chart – downward.
Conclusion from comprehensive analysis: Downward movement.
Overall summary of the weekly EUR/USD candle calculation:The price will most likely show a downward trend during the week, with the first upper shadow forming on the weekly black (bearish) candle (Monday – upward movement), and the second lower shadow (Friday – upward movement).
Alternative scenario:From the 1.1537 level (closing of the last weekly candle), the pair may continue moving downward toward 1.1266 – the 76.4% retracement level (blue dashed line). Upon testing this level, the price may rebound upward toward 1.1391 – the 61.8% retracement level (blue dashed line).


