


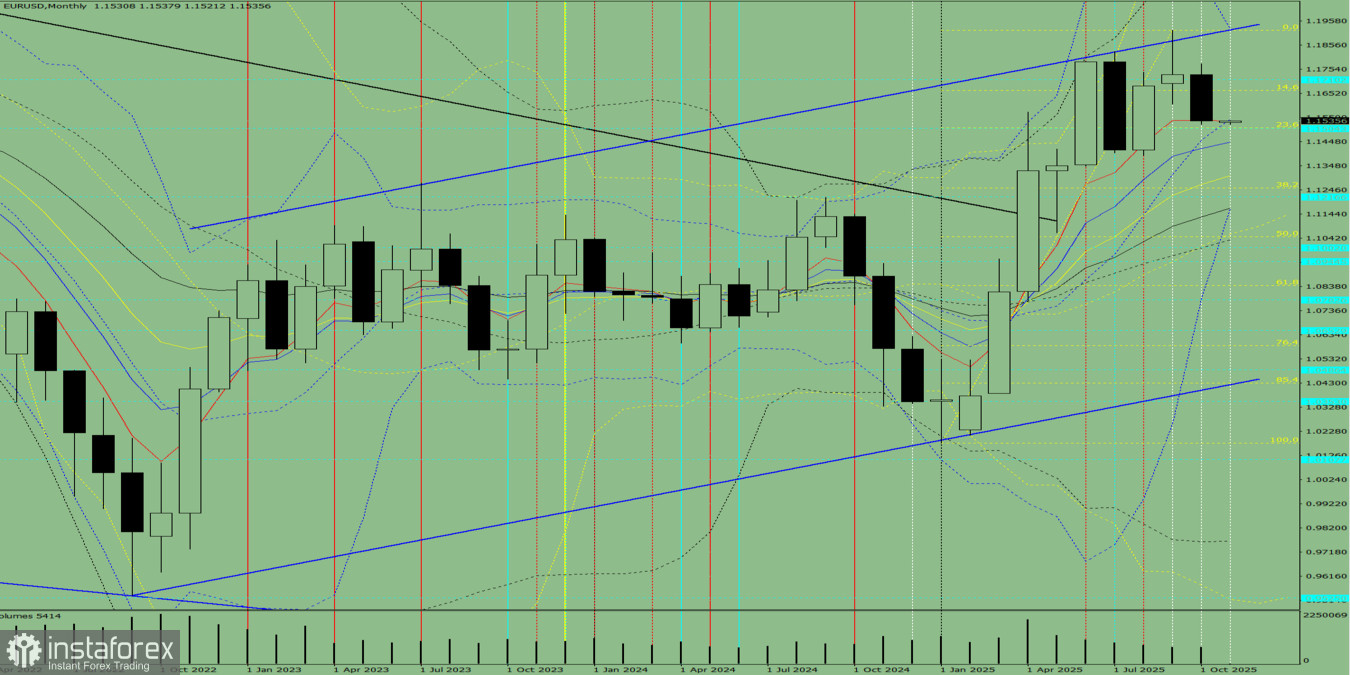
Fig. 1 (Monthly Chart).
Indicator Analysis:
- Indicator analysis – downward;
- Fibonacci levels – downward;
- Volumes – downward;
- Candlestick analysis – downward;
- Trend analysis – downward;
- Bollinger Bands – downward.
Conclusion from comprehensive analysis: A downward trend is possible.
Overall summary of the monthly EUR/USD candle calculation:The price will most likely show a downward trend, with no upper shadow on the monthly black (bearish) candle (the first week of the month – bearish), and with the second lower shadow forming later (the last week of the month – bullish).
Alternative scenario:From the 1.1537 level (closing of the October monthly candle), the price may continue moving downward toward 1.1217 – a historical support level (light blue dashed line). From this line, an upward movement toward 1.1252 – the 38.2% retracement level (yellow dashed line) – is possible.


