


Trade Review for Monday:
1H Chart of the GBP/USD Pair
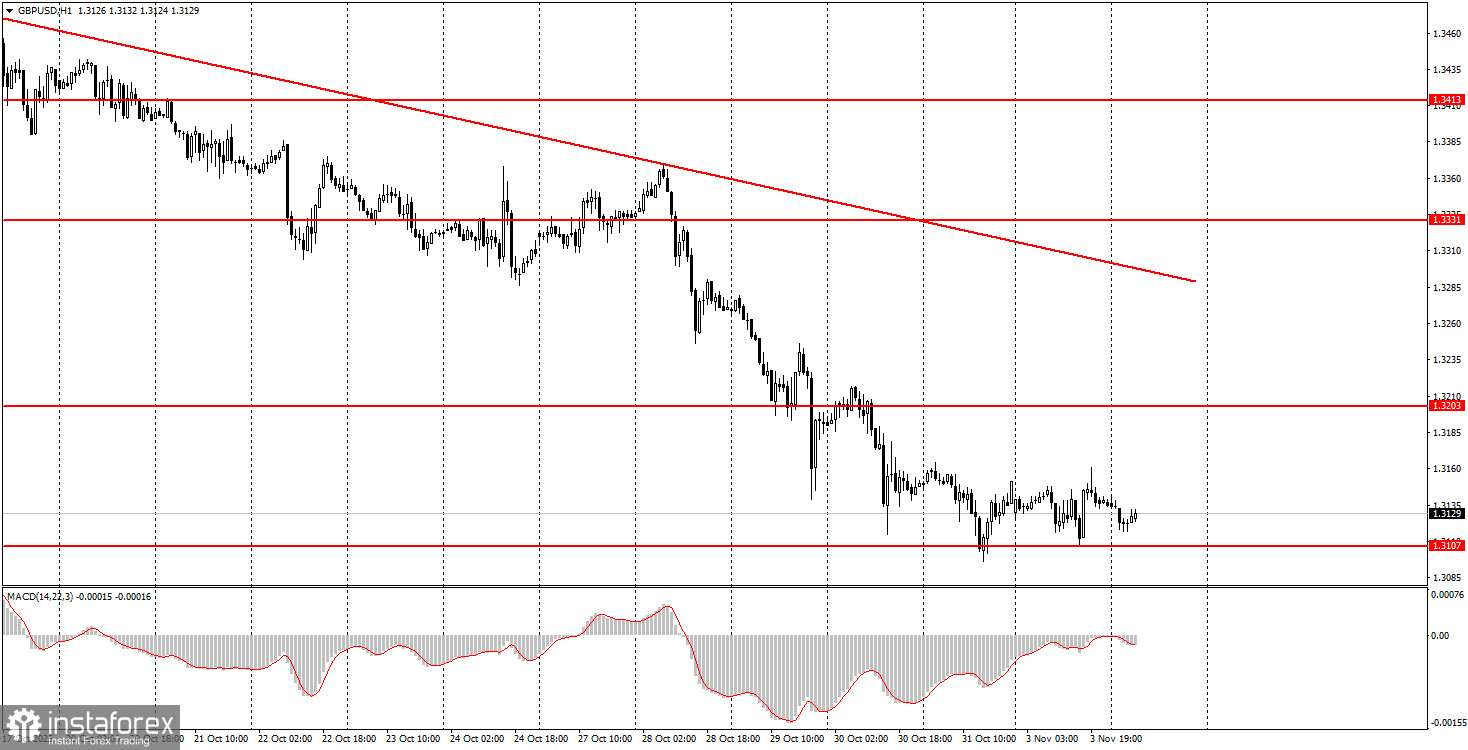
On Monday, the GBP/USD pair made yet another attempt to break through the level of 1.3107, resulting in a third bounce. However, traders are not giving up and will attempt a fourth try to push lower today. The recent movement of the British pound can best be characterized as "paradoxical." There are no legitimate grounds for the pound to decline, yet the price continues to drop almost daily. On Monday, the only somewhat significant report fell short for the US dollar. Thus, based solely on this report, one could have anticipated a rise in the pair. We note that in recent weeks, there have been virtually no corrections against the downward trend. This indicates that the pound is falling almost every day, with no substantial reasons and without even correcting. We continue to consider the current movement illogical and remind that on the daily timeframe, the price has reached the lower boundary of the sideways channel. Consequently, a bounce and a prolonged rise of the pair are possible.
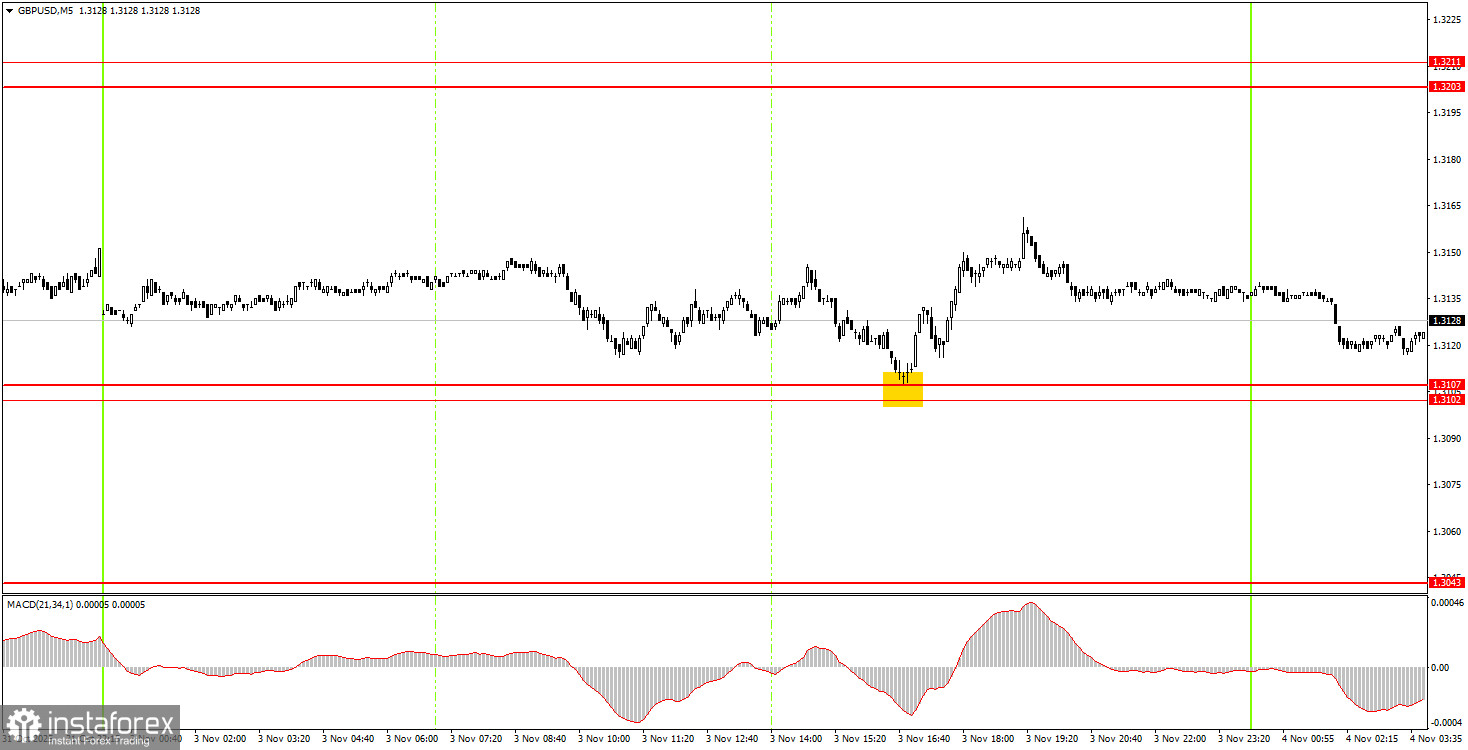
5M Chart of the GBP/USD Pair
How to Trade on Tuesday:
On the hourly timeframe, the GBP/USD pair began to form a new upward trend but quickly ended it. Currently, the British pound is declining again for absolutely any reasons. As mentioned earlier, there are no grounds for the dollar's prolonged growth, so we expect only upward movement in the medium term. However, the flat factor in the long term continues to pull the pair down —an utterly illogical development.
On Tuesday, novice traders can comfortably trade in the 1.3102-1.3107 range. We remind you that this is not just an area but also the lower line of the sideways channel on the daily timeframe. The probability of a significant bounce is high, but without buying, there will be no upward movement in the market.
On the 5-minute timeframe, trading can take place at the following levels: 1.2980-1.2993, 1.3043, 1.3102-1.3107, 1.3203-1.3211, 1.3259, 1.3329-1.3331, 1.3413-1.3421, 1.3466-1.3475, 1.3529-1.3543, 1.3574-1.3590, and 1.3643-1.3652. On Tuesday, no significant events or reports are scheduled in the UK or the US, so it is unlikely volatility will rise today, suggesting a good trend movement.
Basic Rules of the Trading System:
- The strength of a signal is determined by the time it took to form (bounce or breach a level). The less time required, the stronger the signal.
- If two or more trades around any level were based on false signals, all subsequent signals from that level should be ignored.
- In a flat market, any pair can generate numerous false signals or none at all. In any case, it's best to stop trading at the first signs of a flat market.
- Trades should be opened during the timeframe between the start of the European session and halfway through the American session; all trades must then be manually closed.
- On the hourly timeframe, signals from the MACD indicator should ideally be traded only in the presence of good volatility and a trend confirmed by a trendline or trend channel.
- If two levels are too close to each other (between 5 and 20 pips), they should be treated as a support or resistance area.
- After the price moves 20 pips in the right direction, a Stop Loss should be set to break even.
What the Charts Show:
- Support and resistance price levels are targets for opening buy or sell positions. Take profit levels can be placed near these.
- The red lines indicate channels or trend lines that show the current trend and suggest the preferred trading direction.
- The MACD indicator (14,22,3) provides a histogram and signal line, serving as an auxiliary indicator that can also be used as a source of signals.
Important: Significant speeches and reports (always listed in the news calendar) can have a significant impact on the movement of the currency pair. Therefore, during their release, one should trade with maximum caution or exit the market to avoid sudden price reversals against the preceding movement.
Beginners trading in the Forex market should remember that not every trade can be profitable. Developing a clear strategy and practicing money management are key to long-term success in trading.


