


Analysis of EUR/USD 5M
The EUR/USD currency pair continued its downward movement on Wednesday. However, the most interesting aspect is not merely the further decline of the European currency. Recall that on Monday, the market essentially ignored the ISM manufacturing activity index, which came in worse than expected. For over a month, we have highlighted the illogical nature of market movements, emphasizing this event. Wednesday arrived, and the U.S. was set to release the ISM services activity index along with the ADP report on the labor market. Let's analyze.
According to the ADP report, the private sector added 42,000 jobs in October. As noted, 42,000 is quite minimal; such a figure cannot be considered positive for the U.S. economy. Nevertheless, it provided another reason for the market to buy the U.S. dollar. However, during the day, the pair's volatility was only... 28 pips. Essentially, there were no movements at all. Does this mean the market ignored a positive report for the dollar? Why? Because the fundamental and macroeconomic backdrop currently holds no influence over the market. The pair continues to decline purely on technical grounds, with a flat position on the daily timeframe.
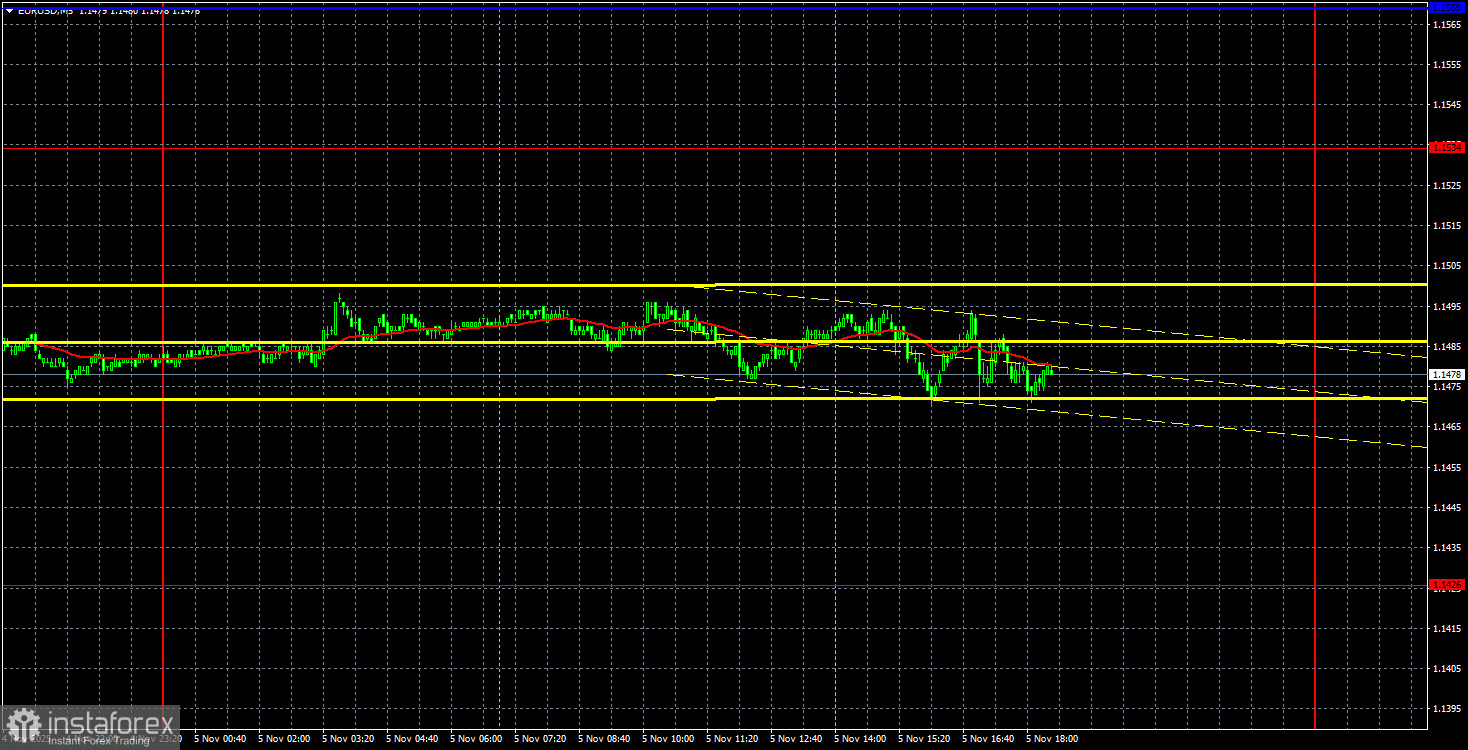
On the 5-minute timeframe, yesterday, the price didn't even attempt to move toward any level. It moved sideways for the entire day with minimal volatility. There were no grounds to open trades.
COT Report
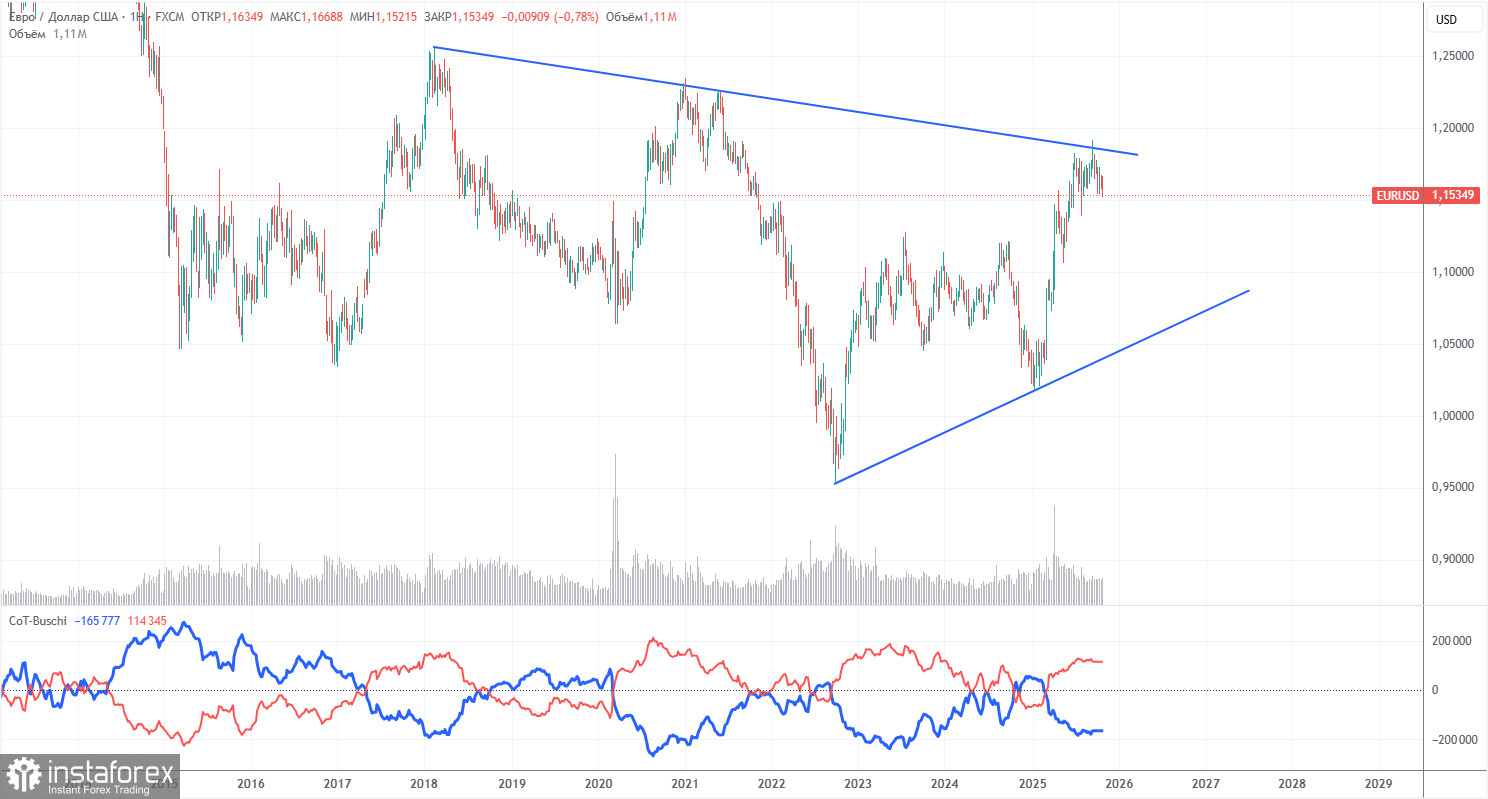
The last COT report is dated September 23. Since then, no further COT reports have been published due to the U.S. "shutdown." The illustration above clearly shows that the net position of non-commercial traders had long been "bullish," with bears barely entering their own zone of superiority at the end of 2024, only to quickly lose it again. Since Trump took office for a second time as U.S. president, the dollar has been in decline. We cannot say with 100% certainty that the decline of the American currency will continue, but current developments around the world suggest it will.
We still do not see any fundamental factors supporting the strength of the European currency, while there remain sufficient factors for the decline of the U.S. dollar. The global downward trend continues, but what relevance does it have to how the price moved in the last 17 years? Once Trump concludes his trade wars, the dollar may start to rise, but recent events indicate that the conflict will persist in some form for a very long time.
The positioning of the red and blue lines of the indicator continues to indicate a "bullish" trend. Over the past reporting week, the number of longs in the "Non-commercial" group decreased by 800, while the number of shorts increased by 2,600. Consequently, the net position decreased by 3,400 contracts over the week. However, this data is now outdated and holds no significance.
Analysis of EUR/USD 1H
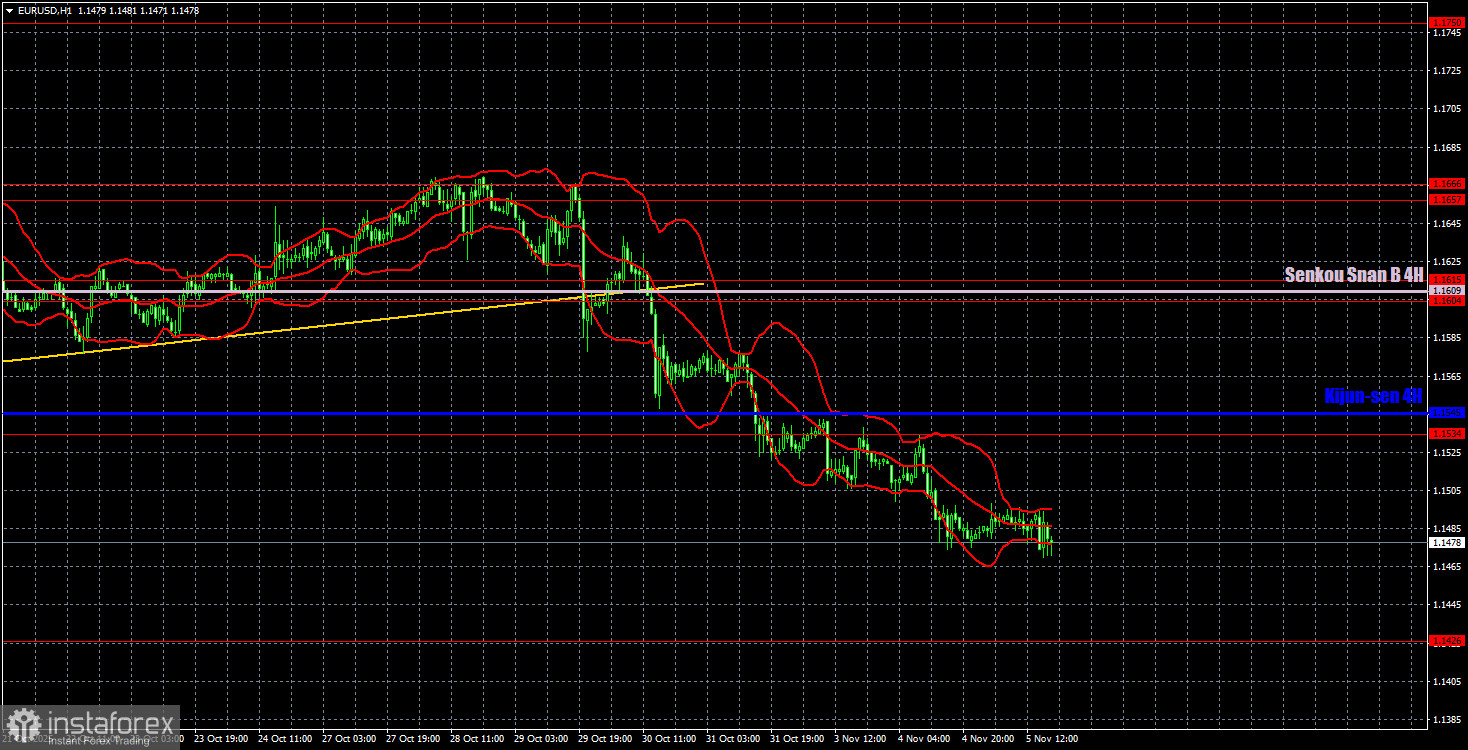
On the hourly timeframe, the EUR/USD pair continues to form another downward trend. Recently, the European currency has been in a consistent decline, and it remains extremely challenging to find explanations that aren't mere conjecture. We believe that the main reason for the inadequate and illogical movements is the flat position on the daily timeframe, which persists.
For November 6, we highlight the following levels for trading: 1.1234, 1.1274, 1.1362, 1.1426, 1.1534, 1.1604-1.1615, 1.1657-1.1666, 1.1750-1.1760, 1.1846-1.1857, 1.1922, 1.1971-1.1988, as well as the Senkou Span B line (1.1609) and Kijun-sen line (1.1545). The Ichimoku indicator lines may move throughout the day, which should be taken into account when determining trading signals. Don't forget to set stop-loss orders at breakeven once the price moves 15 pips in the right direction. This will protect against potential losses if the signal turns out to be false.
On Thursday, Germany is set to publish industrial production reports, and the Eurozone will release retail sales data. But who cares about macroeconomic data right now? This week, the market has ignored at least three significant U.S. reports.
Trading Recommendations
On Thursday, traders may expect a continuation of the decline, with short positions potentially opened from the 1.1534 level on Tuesday. When it comes to new trading signals, they can only be formed around the levels of 1.1534 and 1.1426. The price is currently situated precisely between these points.
Explanations for Illustrations:
- Support and resistance price levels are shown as thick red lines, near which the movement may end. They are not sources of trading signals.
- Kijun-sen and Senkou Span B lines are lines from the Ichimoku indicator transferred to the hourly timeframe from the 4-hour timeframe. They are strong lines.
- Extreme levels are thin red lines from which the price previously bounced. They are sources of trading signals.
- Yellow lines are trend lines, trend channels, and any other technical patterns.
- Indicator 1 on COT charts represents the size of each category of traders' net position.


