


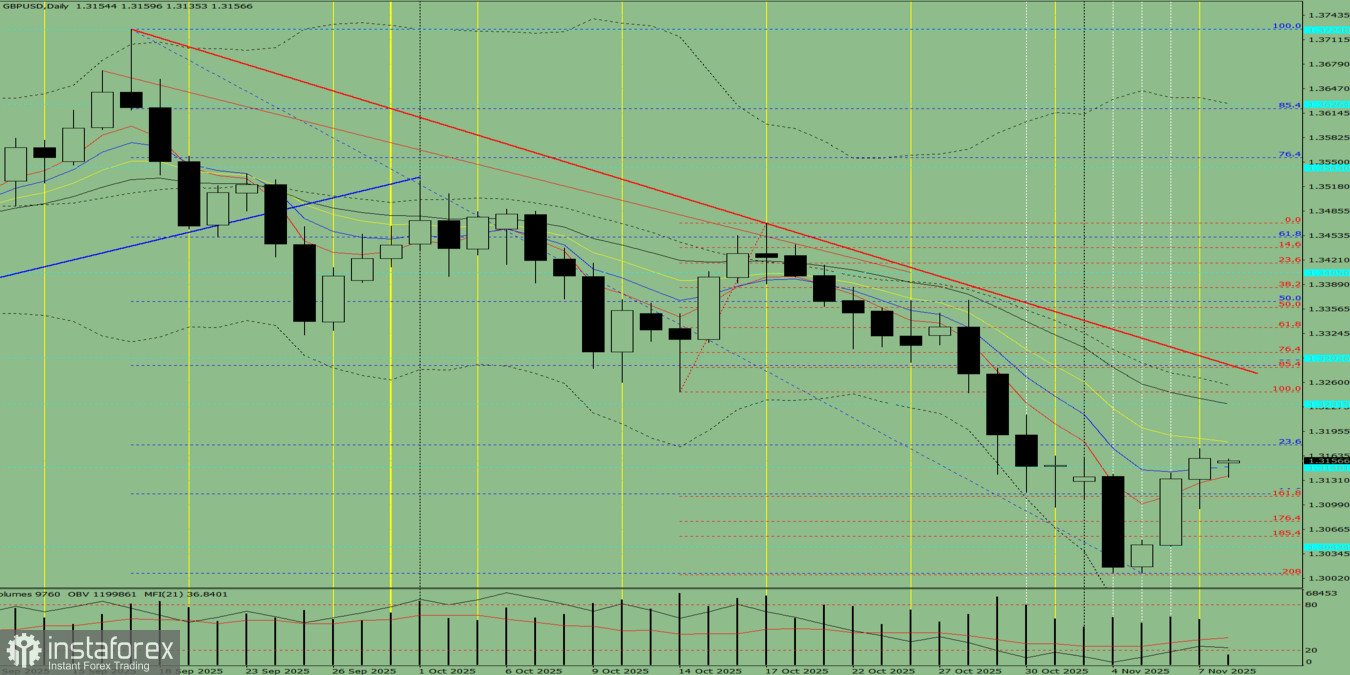
Fig. 1 (Daily Chart)
Comprehensive Analysis:
- Indicator analysis — downward
- Fibonacci levels — downward
- Volume analysis — downward
- Candlestick analysis — downward
- Trend analysis — downward
- Bollinger Bands — downward
- Weekly chart — downward
Overall conclusion: Downward trend.
Alternative Scenario:
From the level of 1.3160 (Friday's daily close), the price may begin moving downward toward 1.3077 — the 176.4% target level (red dotted line). Upon testing this level, the price may then move upward toward 1.3110 — the 161.8% target level (red dotted line).


