


Trend Analysis (Fig. 1)
On Tuesday, from the level of 1.3184 (the close of yesterday's daily candle), the market may begin to move downward with a target of 1.3110 – the 161.8% target level (red dashed line). When testing this level, the price may possibly begin to move upward with a target of 1.3148 – the historical resistance level (blue dashed line).
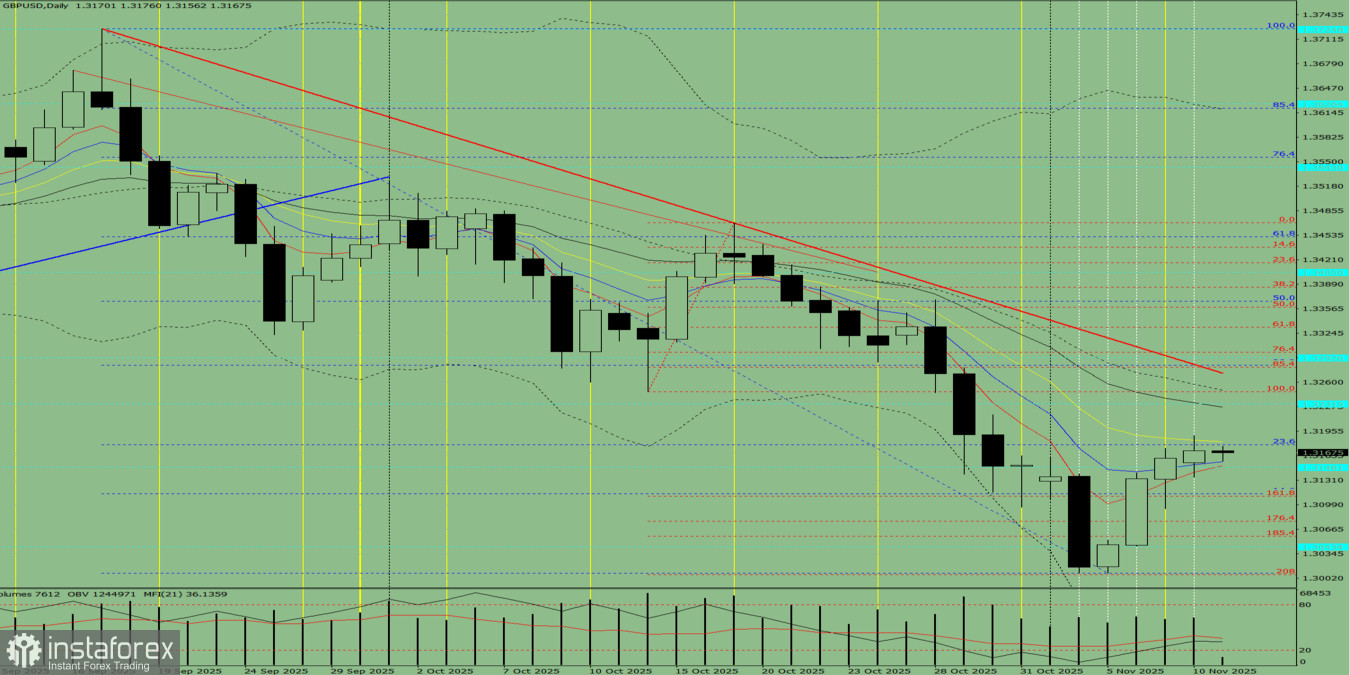
Fig. 1 (Daily Chart)
Comprehensive Analysis:
- Indicator analysis – downward
- Volume – downward
- Candlestick analysis – downward
- Trend analysis – downward
- Bollinger Bands – downward
- Weekly chart – downward
Overall conclusion: downward trend.
Alternative scenario:From the level of 1.3184 (the close of yesterday's daily candle), the price may begin to move downward with a target of 1.3077 – the 176.4% target level (red dashed line). Upon testing this level, the price may possibly begin to move upward toward 1.3110 – the 161.8% target level (red dashed line).


