


Trade Analysis and Advice on Trading the Japanese Yen
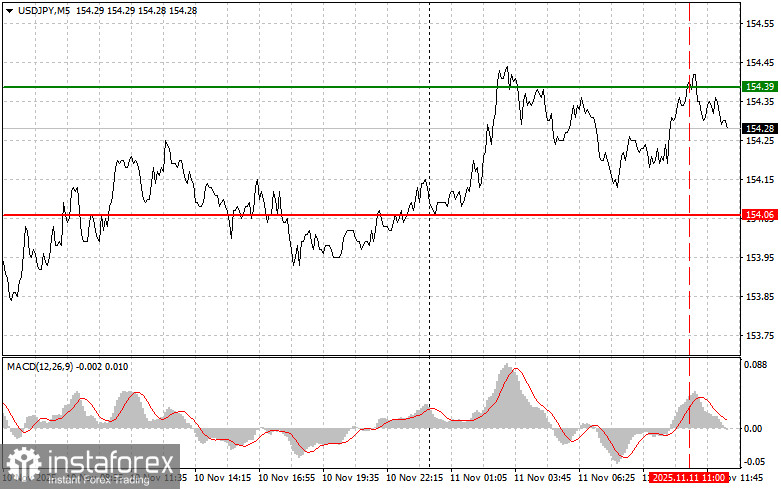
The test of the 154.39 price occurred when the MACD indicator had already moved significantly above the zero mark, which limited the pair's upward potential. For this reason, I did not buy the dollar.
In the second half of the day, the only release will be the NFIB Small Business Optimism Index in the U.S., and only strong data could trigger a new wave of growth in USD/JPY. Otherwise, yen strengthening could lead to a decent correction in the pair. Traders are closely monitoring any signals that might indicate a change in Bank of Japan policy, as well as the actions of the Ministry of Finance, which has repeatedly expressed dissatisfaction with the current exchange rate of the yen.
However, there is also an alternative scenario. If the NFIB data comes out better than expected, it may be interpreted as a sign of U.S. economic stability. In this case, the pair could show a slight rise, though it's unlikely the dollar will climb above 155 yen.
As for the intraday strategy, I will rely mainly on Scenarios #1 and #2.
Buy Signal
Scenario #1: Today, I plan to buy USD/JPY when the price reaches the entry point around 154.45 (green line on the chart), aiming for growth toward 154.75 (the thicker green line on the chart). Around 154.75, I plan to exit long positions and open short ones in the opposite direction (targeting a 30–35 point move in the opposite direction from that level). The pair's growth can be expected as part of the continuation of the bullish market.Important! Before buying, make sure that the MACD indicator is above the zero mark and just starting to rise from it.
Scenario #2: I also plan to buy USD/JPY today if there are two consecutive tests of the 154.23 price level while the MACD indicator is in the oversold area. This will limit the pair's downward potential and lead to a market reversal upward. Growth toward the opposite levels of 154.45 and 154.75 can be expected.
Sell Signal
Scenario #1: Today, I plan to sell USD/JPY after the 154.23 level is updated (red line on the chart), which should trigger a rapid decline in the pair. The key target for sellers will be 153.90, where I plan to exit short positions and immediately open long ones in the opposite direction (expecting a 20–25 point move back from that level). Downward pressure on the pair is unlikely to return today.Important! Before selling, make sure that the MACD indicator is below the zero mark and just starting to move down from it.
Scenario #2: I also plan to sell USD/JPY today if there are two consecutive tests of the 154.45 price level while the MACD indicator is in the overbought area. This will limit the pair's upward potential and lead to a market reversal downward. A decline toward the opposite levels of 154.23 and 153.90 can be expected.
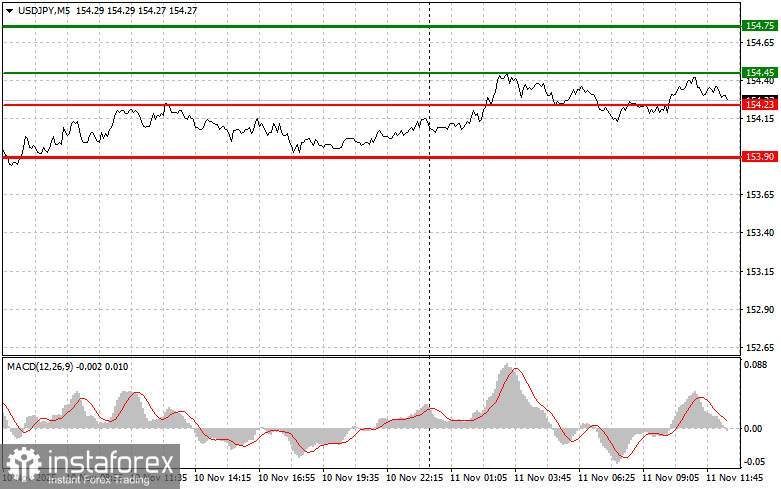
Chart Explanation
- Thin green line – Entry price level where you can buy the trading instrument.
- Thick green line – Expected level where you can place a Take Profit or manually fix profits, as further growth above this level is unlikely.
- Thin red line – Entry price level where you can sell the trading instrument.
- Thick red line – Expected level where you can place a Take Profit or manually fix profits, as further decline below this level is unlikely.
- MACD indicator – When entering the market, it's important to take into account overbought and oversold zones.
Important Note for Beginners
Beginner Forex traders must make market entry decisions with great caution. Before the release of major fundamental reports, it's best to stay out of the market to avoid sharp price swings. If you decide to trade during news releases, always use stop orders to minimize losses. Without stop orders, you can very quickly lose your entire deposit — especially if you neglect money management and trade with large volumes.
And remember: successful trading requires a clear trading plan, like the example I've presented above. Spontaneous trading decisions based on the current market situation are an inherently losing strategy for intraday traders.


