


GBP/USD Analysis on 5M
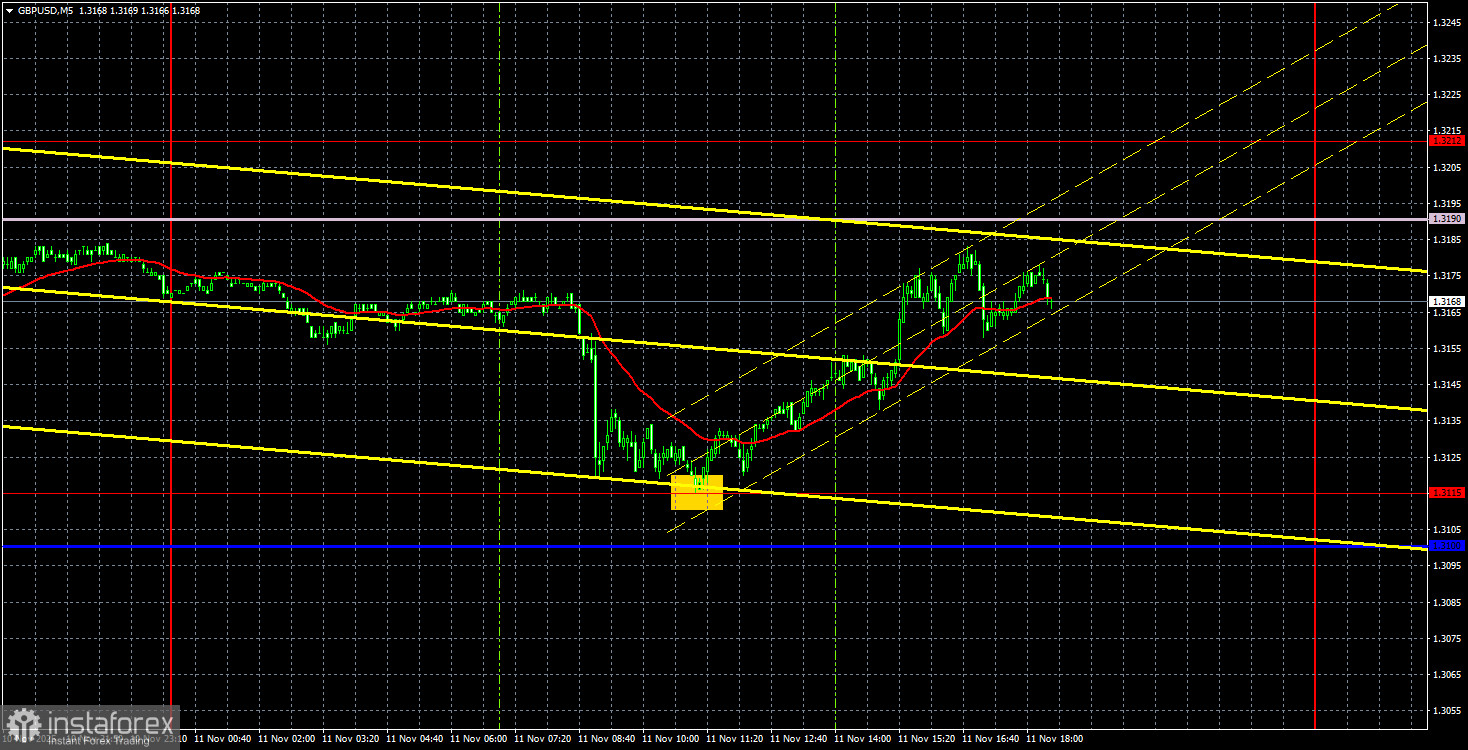
The GBP/USD currency pair started Tuesday on a downward trajectory. It cannot be said that this decline was significant – only 45 pips. By the end of the American trading session, the pound had already recovered all its losses. However, in the first half of the day, there were grounds for the decline, as the UK unemployment rate rose to 5% from the expected 4.9%. It is clear that traders could not ignore such a failure, but at the same time, the reaction, as anticipated, turned out to be weak.
What explains the rise of the pound in the second half of the day? Firstly, the pound had been falling for 1.5 months in a row with no clear reason. Secondly, any decline of the pair on the daily timeframe is a correction. And corrections end sooner or later. Thirdly, the global fundamental background remains unfavorable for the US dollar, meaning it may continue to decline in the medium term, even without local macroeconomic reasons. The pair is confidently moving toward breaking the downward trend, with a clear goal of surpassing the Senkou Span B line and the trend line.
On the 5-minute timeframe, at least one excellent buy signal was formed yesterday. During the European trading session, the price reached the 1.3115 level point-for-point. Following that, an upward movement began, and by the end of the day, the Senkou Span B line was reached, where profits could be fixed, around 50-60 pips.
COT Report
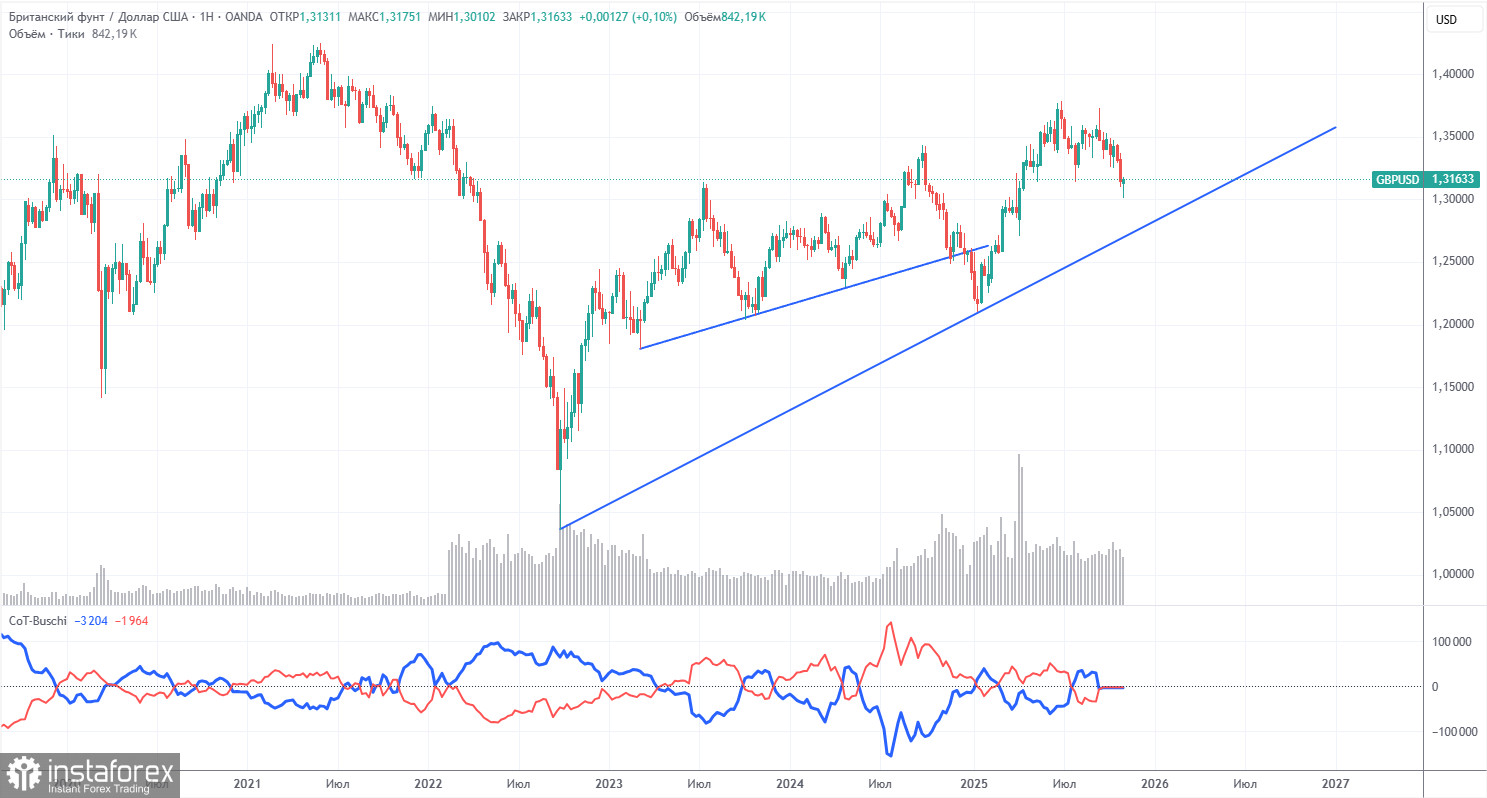
COT reports for the British pound show that commercial traders' sentiment has been changing constantly in recent years. The red and blue lines representing the net positions of commercial and non-commercial traders frequently cross each other and are mostly near the zero mark. Currently, they are at almost the same level, indicating approximately equal amounts of long and short positions.
The dollar continues to decline due to Donald Trump's policies, so market makers' demand for sterling is not particularly significant at the moment. The trade war will continue in one form or another for a long time. The Fed will, in any case, lower rates in the coming year, leading to a decline in dollar demand in one way or another. According to the latest report (dated September 23) on the British pound, the "Non-commercial" group opened 3,700 BUY contracts and closed 900 SELL contracts. Thus, the net position of non-commercial traders increased by 4,600 contracts over the week. However, this data is already outdated, and there are no new reports.
In 2025, the pound rose significantly, but one must understand that this was due to Donald Trump's policies. Once this reason is mitigated, the dollar may begin to rise, but when this will happen is anyone's guess. It does not matter how fast the net position for the pound is increasing or decreasing. The net position for the dollar is declining in any case, and it is generally declining faster.
GBP/USD Analysis on 1H
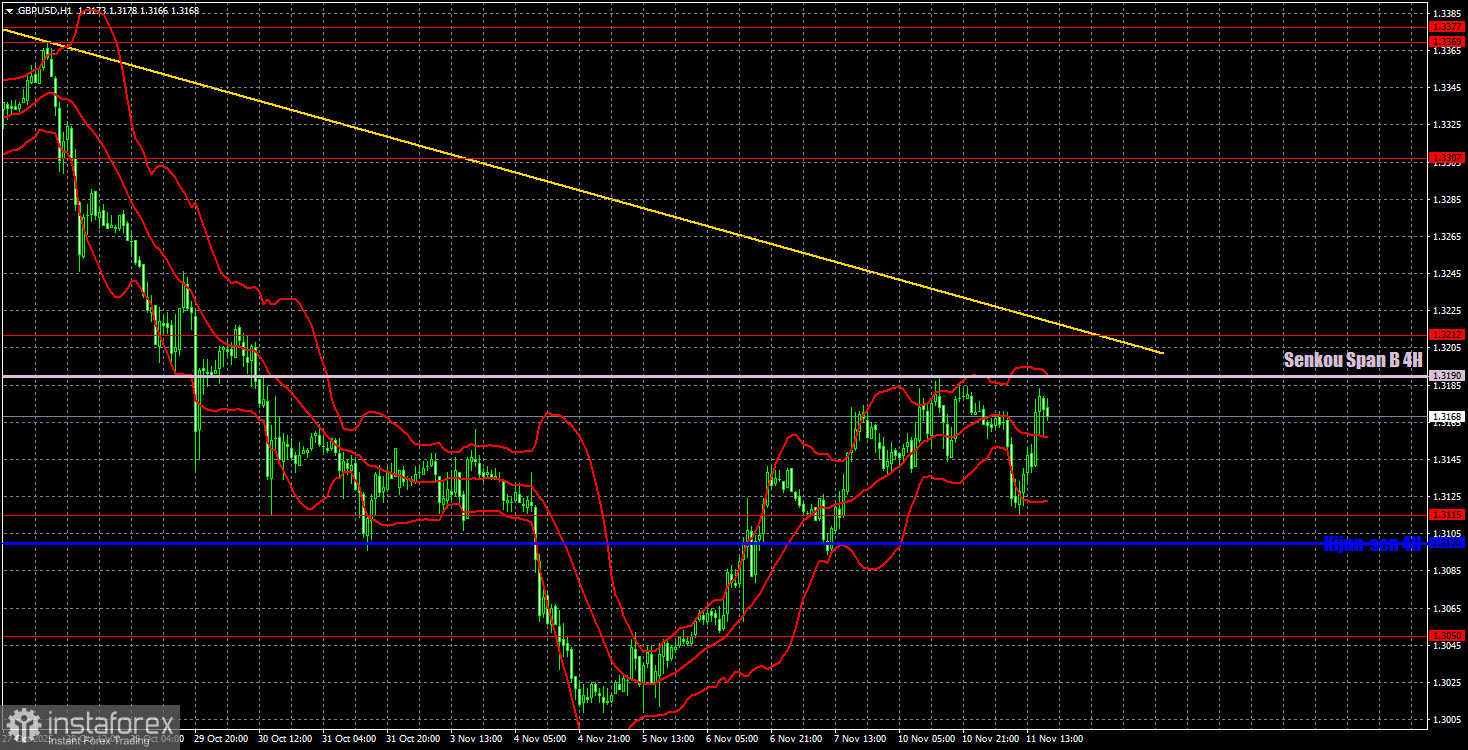
On the hourly timeframe, the GBP/USD pair continues to form a downward trend. The dollar still has no global reasons to strengthen, so we expect the pair to rise to the highs of 2025 in almost any case. Last week, the price broke the Kijun-sen line, and this week it may surpass the trend line and the Senkou Span B line. If the attempt is successful, the trend will shift upward. We believe growth will continue regardless of the macroeconomic and fundamental backdrop.
For November 12, we highlight the following important levels: 1.2863, 1.2981-1.2987, 1.3050, 1.3115, 1.3212, 1.3307, 1.3369-1.3377, 1.3420, 1.3533-1.3548, 1.3584. The Senkou Span B (1.3190) and Kijun-sen (1.3100) lines may also be sources of signals. It is recommended to set the Stop Loss to break-even once the price moves in the correct direction by 20 pips. The Ichimoku indicator lines may move during the day, which should be taken into account when determining trading signals.
No significant events are scheduled for Wednesday in the UK and the US, so the volatility throughout the day may not be very strong. At the same time, we expect further growth of the British pound, as the global downward correction has long been overdue for completion.
Trading Recommendations:
Today, traders may consider new short positions if there is a new bounce from the Senkou Span B line, targeting 1.3115. However, we would advise caution with shorts right now. Much more relevant are buy positions upon overcoming the Senkou Span B line and the 1.3212 level, with a target of 1.3307.Explanations for Illustrations:
- Support and resistance price levels are shown as thick red lines, near which the movement may end. They are not sources of trading signals.
- Kijun-sen and Senkou Span B lines are lines from the Ichimoku indicator transferred to the hourly timeframe from the 4-hour timeframe. They are strong lines.
- Extreme levels are thin red lines from which the price previously bounced. They are sources of trading signals.
- Yellow lines are trend lines, trend channels, and any other technical patterns.
- Indicator 1 on COT charts represents the size of each category of traders' net position.


