


Trend Analysis (Fig. 1).
On Friday, the market may continue moving upward from the level of 1.1632 (yesterday's daily candle close), targeting 1.1655 – the 50% retracement level (blue dashed line). When testing this level, a downward retracement movement may occur, targeting 1.1640 – the 38.2% retracement level (yellow dashed line).
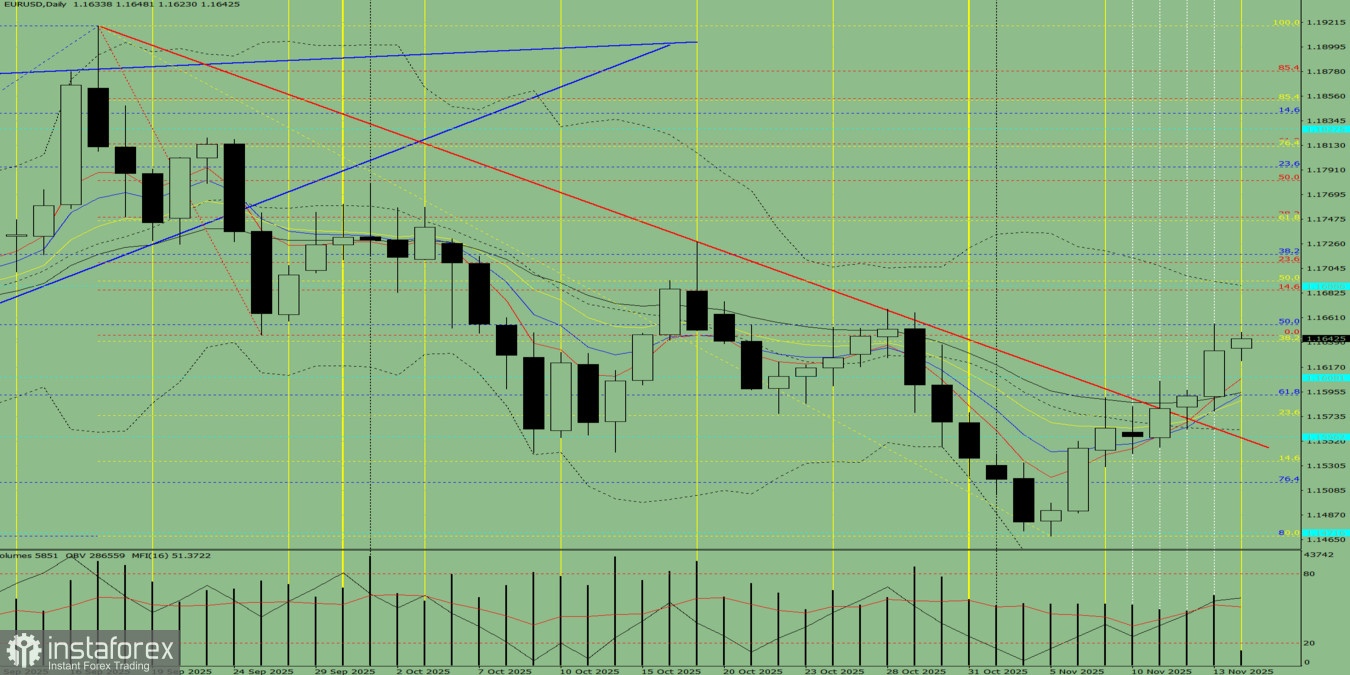
Fig. 1 (daily chart).
Composite Analysis:
- Indicator analysis – upward
- Fibonacci levels – upward
- Volumes – upward
- Candlestick analysis – upward
- Trend analysis – upward
- Bollinger Bands – upward
- Weekly chart – upward
Overall conclusion: upward trend.
Alternative scenario: Today, from the level of 1.1632 (yesterday's daily candle close), the price may continue moving upward toward 1.1685 – the 14.6% retracement level (red dashed line). When testing this level, a downward retracement movement toward 1.1655 – the 50% retracement level (blue dashed line) is possible.


