


Trend Analysis
This week, from the level of 1.3169 (the close of the latest weekly candle), the price may continue moving downward toward 1.2942 – the 50% retracement level (red dashed line). Upon testing this level, the price may pull back upward toward 1.3044 – the historical support level (blue dashed line).
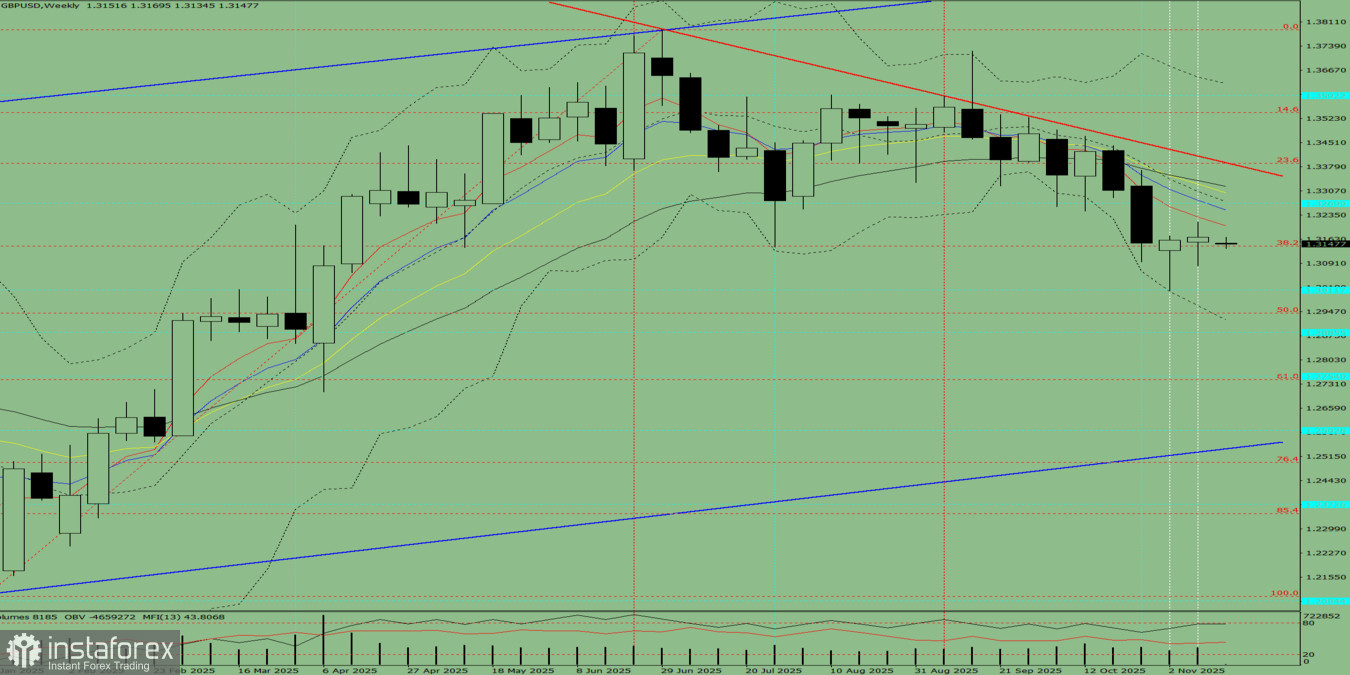
Fig. 1 (weekly chart).
Comprehensive Analysis:
- indicator analysis – downward
- Fibonacci levels – downward
- volumes – downward
- candlestick analysis – downward
- trend analysis – downward
- Bollinger Bands – downward
- monthly chart – downward
Final Summary of the Weekly Candle Projection for GBP/USD:
During the week, the price will most likely show a downward trend, with no upper shadow on the weekly black candle (Monday – downward) and the presence of a lower shadow (Friday – upward).
Alternative Scenario:
From the level of 1.3169 (the close of the latest weekly candle), the price may continue moving downward toward 1.3012 – the historical support level (blue dashed line). Upon reaching this level, the price may move upward toward 1.3083 – the lower fractal (weekly candle from November 2, 2025).


