


The EUR/USD currency pair traded very calmly on Tuesday, with no significant events throughout the day. In principle, there are almost daily speeches from representatives of the European Central Bank and/or the Federal Reserve, but they currently carry little significance for the market. For at least the past month and a half, traders have ignored many factors, news, events, and reports. Thus, completely neutral statements from central bank officials are of no interest to them.
The ECB does not plan to undertake monetary policy easing in the near future. The Fed is eyeing a pause in December, but at the same time (as always before) points to macroeconomic data, which will determine the central bank's decision. Therefore, until we know the state of the U.S. labor market, discussing the Fed's decision in December makes little sense. It would be one thing if this information were available to the Fed itself, and from the statements of its officials, we could understand what to expect. However, this data is not even available to the central bank.
This Thursday, with a month-and-a-half delay, the Non-Farm Payrolls report for September will be released. Honestly, it is challenging to understand how to approach this. It is evident that it will provoke a spike in volatility and likely a significant one. However, everyone in the market understands that this data is nearly two months old and currently holds almost no value, since at that time the Fed had not even resumed its monetary policy easing cycle.
Thus, a relatively high Non-Farm number may indeed support the U.S. dollar, but it will not change the global trend and overall outlook for the American currency. It's worth noting that the EUR/USD pair has been flat for several months now, trading between 1.1400 and 1.1830 on the daily timeframe. Therefore, the flat is the most critical aspect at this moment. The Non-Farm Payrolls report on Thursday may merely help traders exit the entrenched range.
However, the September Non-Farm Payrolls do not allow us to make any conclusions regarding the Fed's December meeting. Data for October and November are needed. It is based on this information that the Fed will judge whether the U.S. labor market is recovering after two consecutive rounds of monetary policy easing or if urgent new easing is required. Additionally, inflation will be of immense importance, as most FOMC officials consider stabilizing inflation to be a higher-priority task. Thus, if inflation in America accelerates further, even amid weakness in the labor market, we should not expect a new rate cut.
For the U.S. dollar, a "neutral" Fed stance in December is a positive development, but changes nothing. The Fed will continue to ease monetary policy in one form or another, while the ECB has already completed its easing. Therefore, the dollar remains a vulnerable currency.
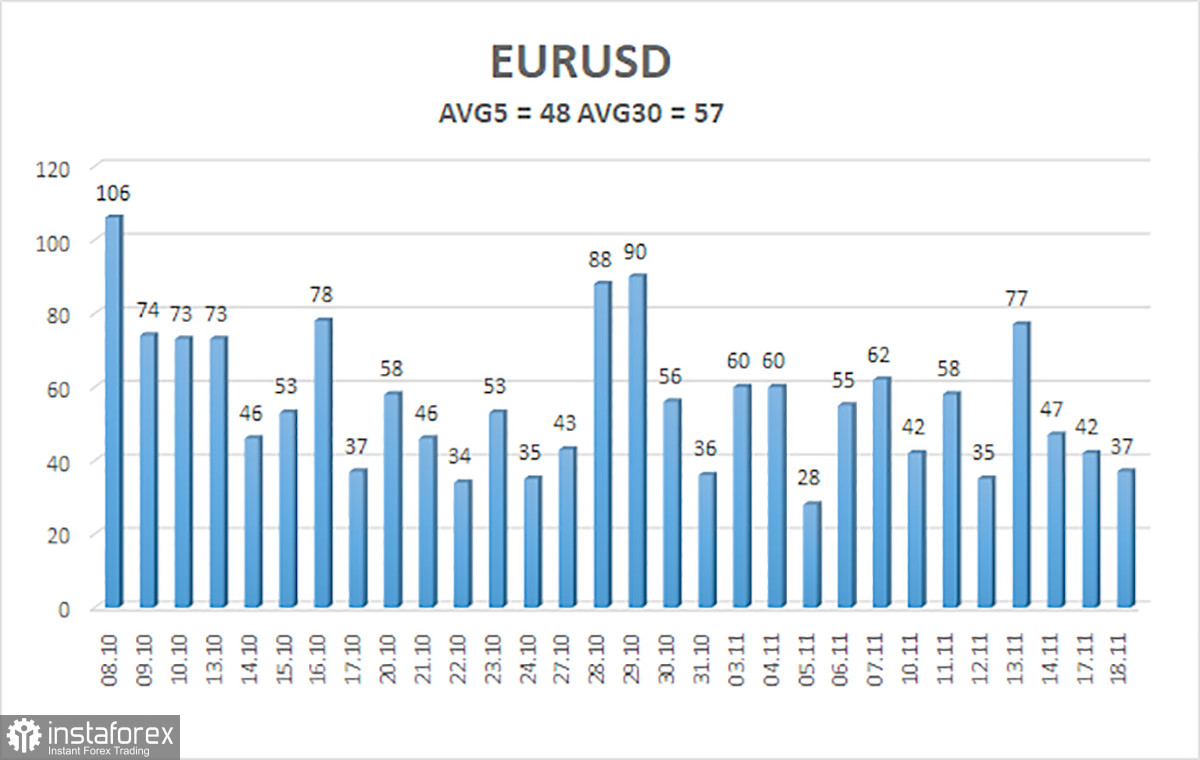
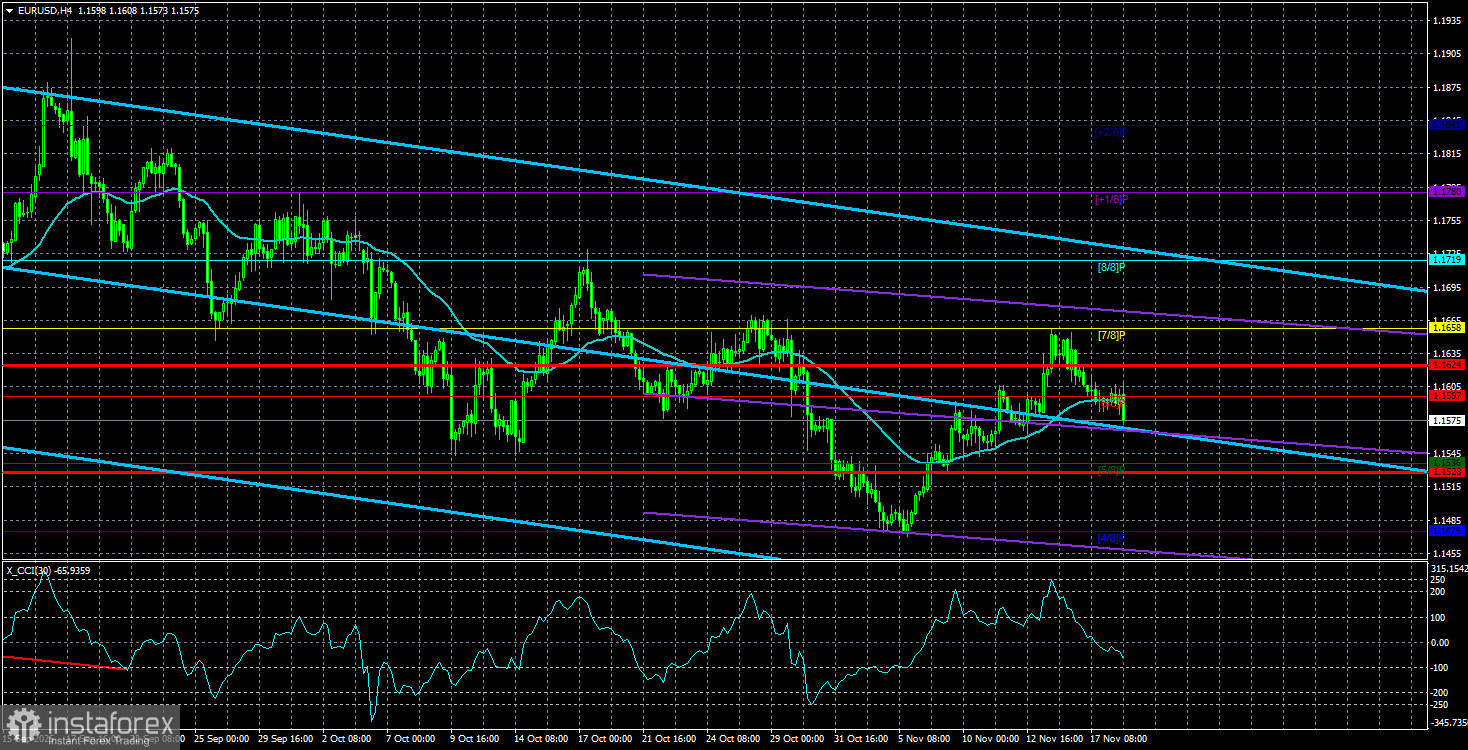
The average volatility of the EUR/USD currency pair over the past five trading days, as of November 19, is 48 pips and is characterized as "low." We expect the pair to trade between 1.1528 and 1.1624 on Wednesday. The higher channel of linear regression is directed downwards, signaling a bearish trend, but in fact, a flat continues on the daily timeframe. The CCI indicator entered the oversold territory twice in October, which may provoke a new wave of the upward trend for 2025.
Nearest Support Levels:
- S1 – 1.1536
- S2 – 1.1475
- S3 – 1.1414
Nearest Resistance Levels:
- R1 – 1.1597
- R2 – 1.1658
- R3 – 1.1719
Trading Recommendations:
The EUR/USD pair has once again stabilized above the moving average, with an upward trend maintained across all higher timeframes, while a flat has persistently continued on the daily timeframe for several months. The global fundamental backdrop continues to exert a strong influence on the U.S. dollar. Recently, the dollar has risen, but the reasons for such a movement may be purely technical. If the price is positioned below the moving average, small short positions may be considered with a target of 1.1528 on purely technical grounds. Above the moving average, long positions remain relevant with a target of 1.1800 (the upper boundary of the flat on the daily timeframe).
Explanations for Illustrations:
- Linear regression channels help determine the current trend. If both are directed in the same way, it indicates that the trend is currently strong.
- The moving average line (settings 20,0, smoothed) defines the short-term trend and the direction in which trading should currently be conducted.
- Murray levels are target levels for movements and corrections.
- Volatility levels (red lines) represent the likely price channel in which the pair will spend the following days, based on current volatility indicators.
- The CCI indicator entering the oversold territory (below -250) or overbought territory (above +250) indicates that a trend reversal in the opposite direction is approaching.


