


Analysis of Tuesday's Trades:
1H Chart of the GBP/USD Pair
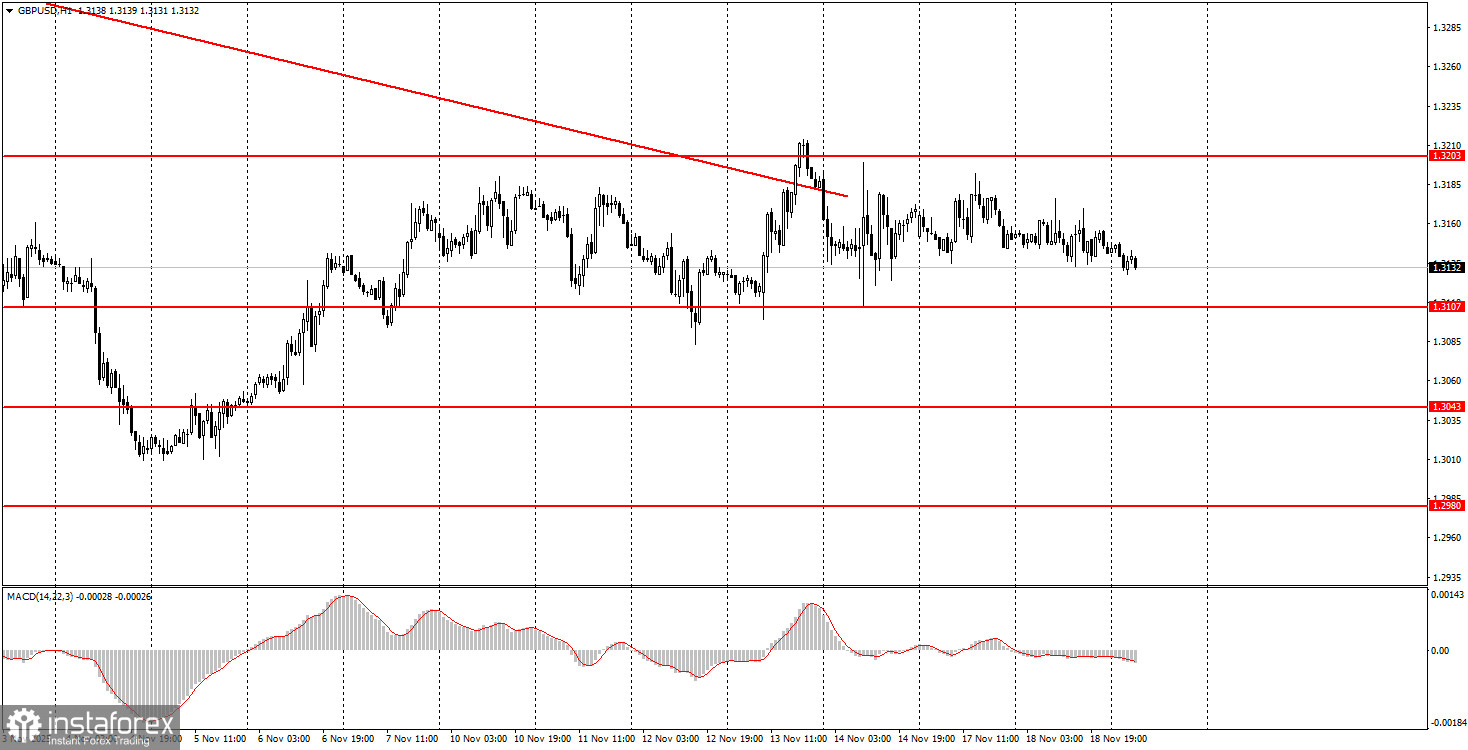
The GBP/USD pair traded sideways on Tuesday with minimal volatility. No important events or reports were scheduled for yesterday, and the flat movement is clearly visible from a kilometer away. The price has been trading between 1.3107 and 1.3203 for over a week, making trading purely based on rebounds from the boundaries of the sideways channel the only option for opening positions. Unfortunately, market movements are currently so weak that the price doesn't always even reach the boundaries of the channel. Consequently, the market is in a total standstill at this time. The market is clearly waiting for important macroeconomic information from the U.S. and preparing for a new trend. Market makers are currently occupied with accumulating new positions, which are most likely long positions. We remind novice traders that a flat is merely the calm before the storm. It is quite possible that when the U.S. begins publishing all the missed labor-market and unemployment reports, the market will awaken. It remains extremely difficult to expect the dollar to grow in the medium term.
5M Chart of the GBP/USD Pair
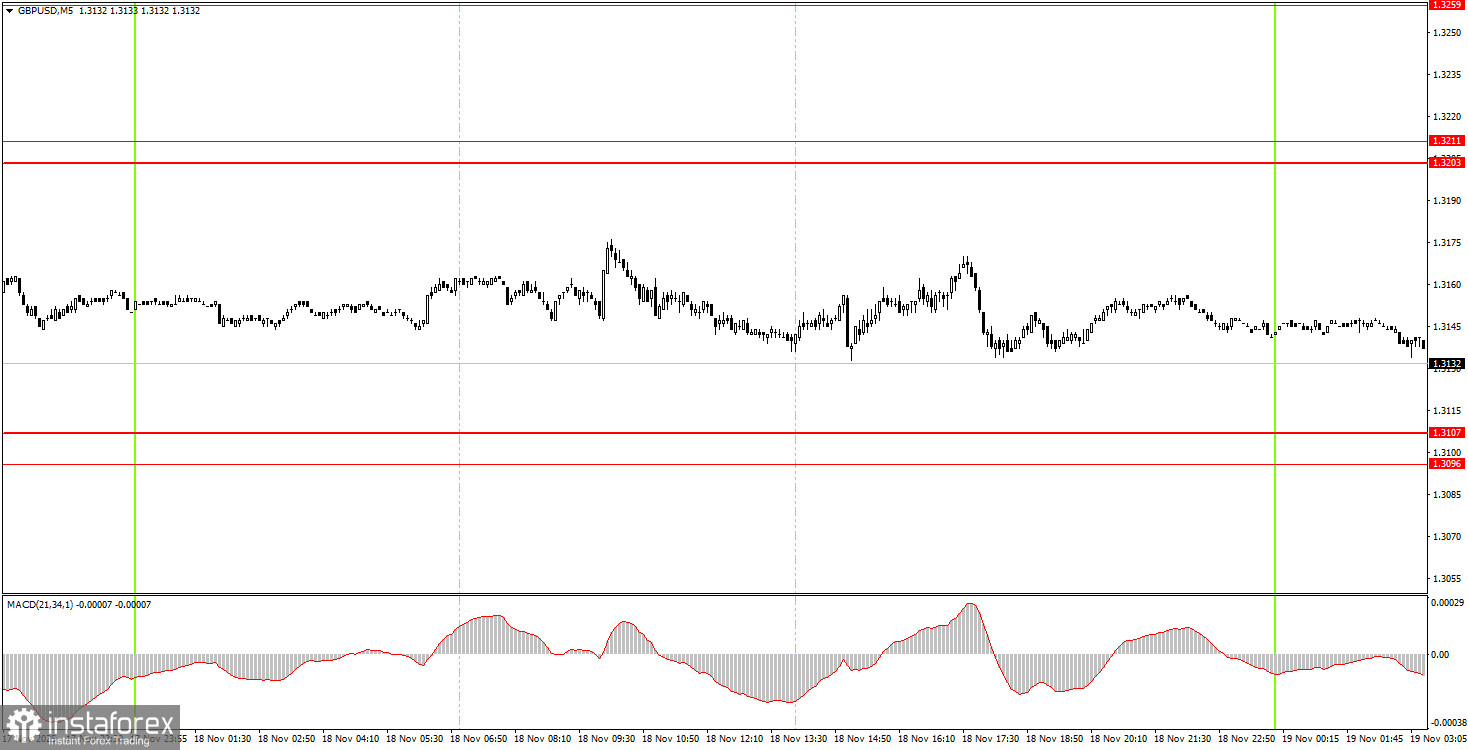
On the 5-minute timeframe, no trading signals were formed on Tuesday. The price did not approach any levels throughout the day, and the overall volatility was around 40 pips. Thus, there were no grounds for opening positions for novice traders.
How to Trade on Wednesday:
On the hourly timeframe, the GBP/USD pair has broken the trend line, so in the coming weeks, we expect the British currency to rise on any local news and reports. As mentioned earlier, there are no global grounds for prolonged dollar growth, so we expect upward movement only in the medium term. If the correction/flat on the daily timeframe is completed, the pair could resume the global upward trend for 2025. However, we must also wait for the flat to end on the hourly timeframe.
On Wednesday, novice traders can expect new trading signals to form in the areas of 1.3096-1.3107 and 1.3203-1.3211, as these are the boundaries of the sideways channel.
On the 5-minute timeframe, the following levels should be considered for trading: 1.2913, 1.2980-1.2993, 1.3043, 1.3096-1.3107, 1.3203-1.3211, 1.3259, 1.3329-1.3331, 1.3413-1.3421, 1.3466-1.3475, 1.3529-1.3543, 1.3574-1.3590. An important inflation report for October is scheduled for release in the UK on Wednesday, but even this report may only lead to a spike in volatility, while the flat will likely remain. In the evening, the minutes from the Federal Reserve's meeting will be published, which holds extremely low significance for the market.
Key Principles of My Trading System:
- The strength of the signal is considered based on the time taken to form the signal (bounce or breach of a level). The less time taken, the stronger the signal.
- If two or more trades have been opened around a certain level based on false signals, all subsequent signals from that level should be ignored.
- In a flat market, any pair can create numerous false signals or may not form them at all. In any case, it's best to stop trading at the first signs of a flat.
- Trading deals are opened during the period between the start of the European session and the middle of the American session, after which all deals should be closed manually.
- On the hourly timeframe, it is preferable to trade based on signals from the MACD indicator only when there is good volatility and a trend that is confirmed by a trend line or trend channel.
- If two levels are too close to each other (between 5 and 20 pips), they should be treated as an area of support or resistance.
- After a 20-pip move in the right direction, a Stop Loss should be set to breakeven.
What the Charts Show:
- Support and resistance price levels are targets for opening buy or sell positions. Take Profit levels can be placed around them.
- Red lines indicate trend channels or trend lines, reflecting the current trend and indicating the preferred trading direction.
- The MACD indicator (14,22,3) — histogram and signal line — is a supplementary indicator that can also be used as a source of signals.
Important announcements and reports (always available in the news calendar) can significantly impact the movement of the currency pair. Therefore, during their release, it is recommended to trade with maximum caution or to exit the market to avoid sharp reversals against the preceding movement.
Beginners trading on the Forex market should remember that not every trade can be profitable. Developing a clear strategy and money management is key to long-term success in trading.


