


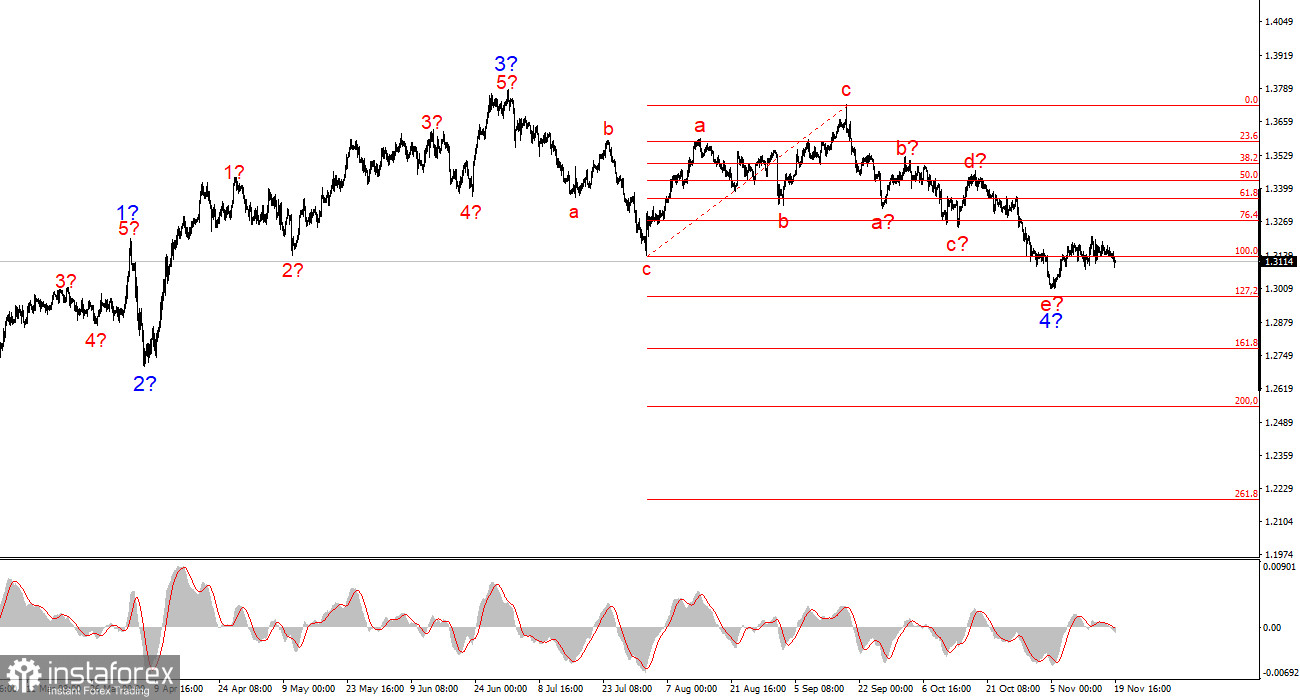
For GBP/USD, the wave pattern continues to indicate the formation of an upward trend segment (bottom chart), but in recent weeks it has taken on a complex and extended shape (top chart). The trend segment that began on July 1 can be considered wave 4—or any large corrective wave—since it has a corrective, not impulsive, internal wave structure. The same applies to its internal subwaves. Therefore, despite the prolonged decline of the pound, I believe the upward trend remains intact.
The downward wave structure that began on September 17 has taken the shape of a five-wave a-b-c-d-e pattern and may now be complete. If that is the case, the instrument is currently at the very beginning of forming a new upward wave sequence.
Of course, any wave structure can become more complex and extended at any moment. Even the assumed wave 4, which has been forming for nearly five months, may take on a five-wave shape—in which case we could see several more months of correction. However, at the moment, an upward wave sequence may be starting to form. If this assumption is correct, we have seen its first wave, and the second wave may be ending at the current levels.
The GBP/USD rate declined by 30 basis points on Wednesday, which can be considered a record for the past week. Market activity and volatility remain minimal, so even a 30-point move is enough to widen eyes. Still, today the market had a reason to sell the British pound. In the morning, the UK released its inflation report for October, showing a slowdown in both core and headline indicators. Since inflation in Britain is declining, the Bank of England may decide to implement another round of monetary easing in December. Therefore, today's fall of the pound is justified.
However, I believe that the pound's fate will be decided tomorrow. In reality, the importance of the US labor market and unemployment reports is debatable, as these are September figures that are already outdated. Nevertheless, the market may simply be waiting for a push, regardless of what that push is. I remind you that sideways phases often end abruptly. The market can trade in a narrow 20-point range for months, ignoring numerous major events, and then suddenly begin a new trend segment. Therefore, tomorrow one must be extremely attentive during the US session. The US reports might trigger only short-lived emotions, after which everything returns to normal. Or there may be a sharp rise or fall, which would help draw conclusions about future direction.
General conclusions
The wave picture for GBP/USD has changed. We are still dealing with an upward impulsive trend segment, but its internal wave structure has become complex. Wave 4 has taken on a three-wave shape, resulting in a very extended structure. The downward corrective a-b-c-d-e structure in wave c of 4 looks fully complete. If that is indeed the case, I expect the main trend segment to resume with initial targets near the 1.38 and 1.40 levels. The key factor is that the US news background should favor the dollar.
The larger-scale wave pattern looks almost ideal, even though wave 4 has overlapped the top of wave 1. But I remind you that perfect wave patterns exist only in textbooks—real market conditions are much more complicated. At the moment, I see no reason to consider alternative scenarios to the upward trend segment.
The main principles of my analysis:
- Wave structures should be simple and clear. Complex structures are difficult to trade and often imply changes.
- If you are unsure about what is happening in the market, it is better not to enter.
- There can never be 100% certainty about the market's direction. Always use protective Stop Loss orders.
- Wave analysis can be combined with other analytical methods and trading strategies.


