


Trend Analysis (Fig. 1)
On Thursday, the market may begin moving upward from the 1.3055 level (yesterday's daily candle close), targeting 1.3077 — the 176.4% target level (red dotted line). From this level, the price may possibly pull back downward, aiming for 1.3057 — the 185.4% target level (red dotted line).
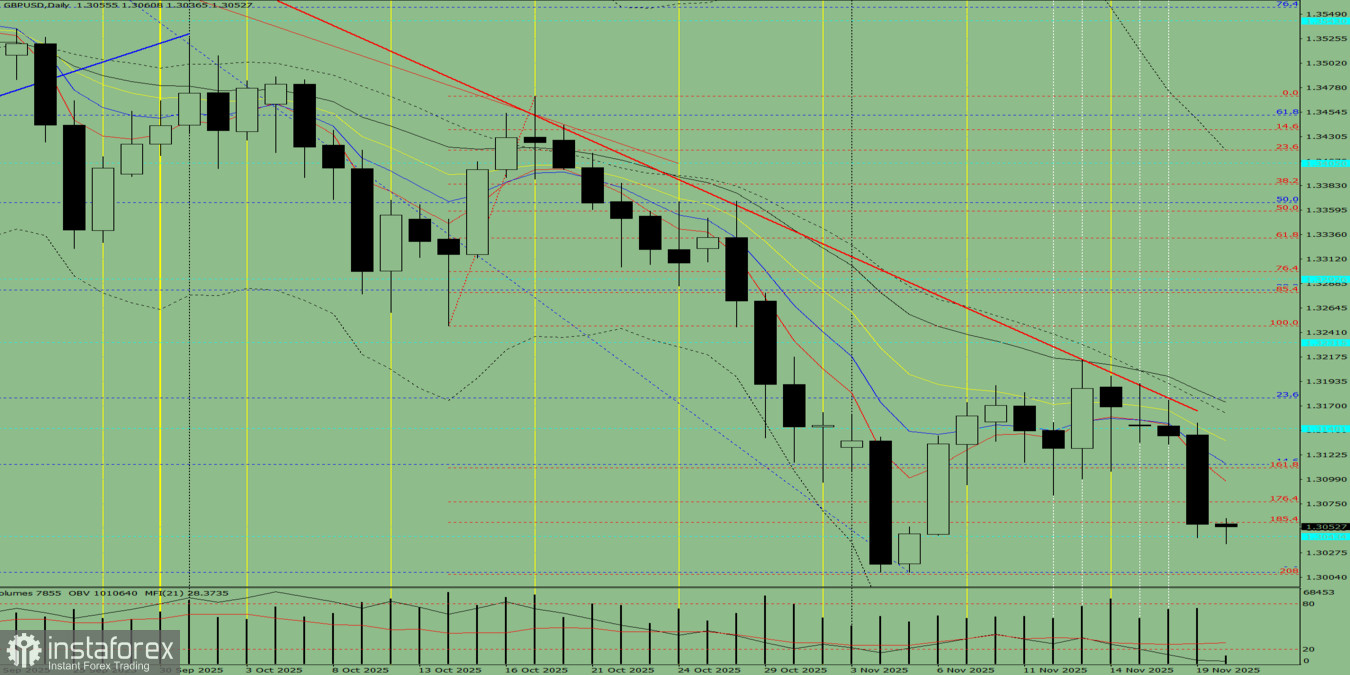
Fig. 1 (Daily Chart)
Comprehensive Analysis:
- Indicator analysis – upward
- Fibonacci levels – upward
- Volumes – upward
- Candlestick analysis – upward
- Trend analysis – upward
- Bollinger Bands – upward
- Weekly chart – upward
Overall conclusion: upward trend.
Alternative scenario: From the 1.3055 level (yesterday's daily candle close), the price may continue moving downward, targeting 1.3043 — the historical support level (light blue dotted line). From this level, the price may possibly bounce upward, targeting 1.3077 — the 176.4% target level (red dotted line).


