


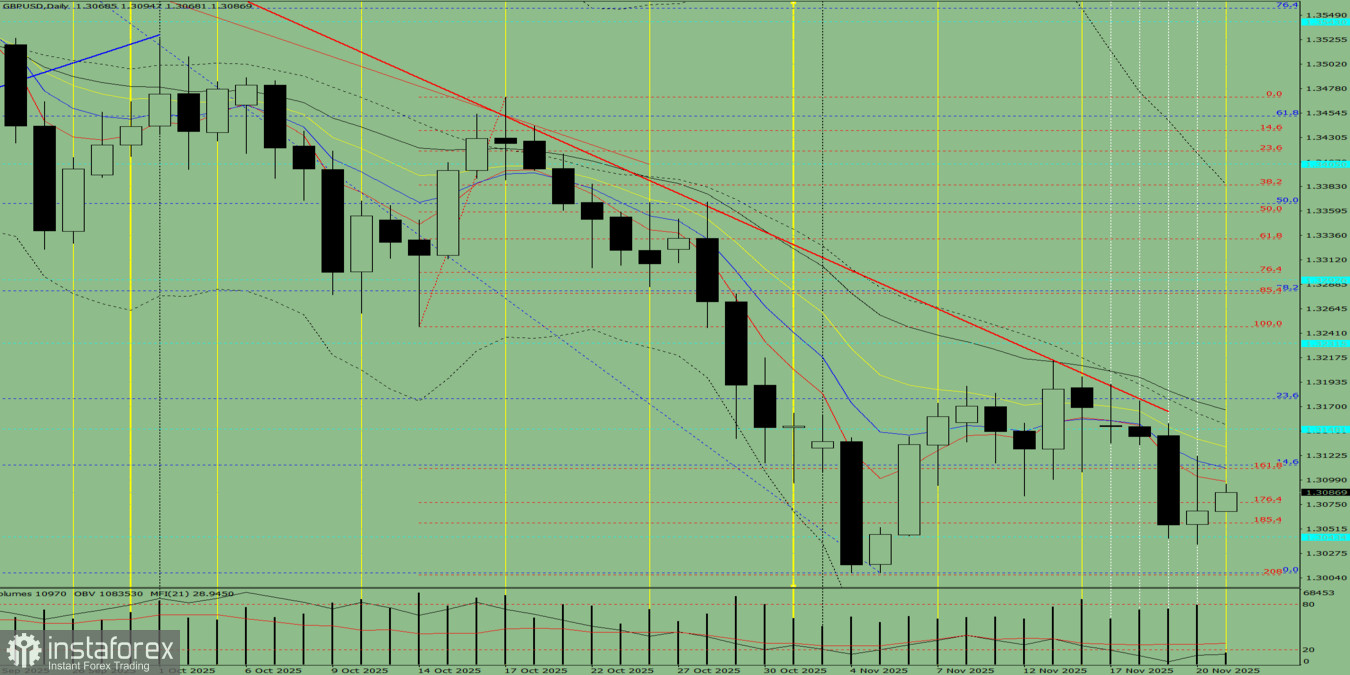
Fig. 1 (daily chart).
Comprehensive Analysis:
- Indicator analysis – upward
- Fibonacci levels – upward
- Volumes – upward
- Candlestick analysis – upward
- Trend analysis – upward
- Bollinger Bands – upward
- Weekly chart – upwardOverall conclusion: upward trend.
Alternative scenario:From the level of 1.3069 (yesterday's daily candle close), the price may begin moving upward with a target of 1.3148 – a historical resistance level (blue dashed line). When testing this level, a downward pullback movement is possible with a target of 1.3113 – the 14.6% pullback level (blue dashed line).


