


Trend Analysis (Fig. 1).
On Monday, the market, from the level of 1.1512 (the close of Friday's daily candle), may begin moving upward toward 1.1556 — a historical resistance level (blue dashed line). Upon reaching this level, a downward move is possible toward 1.1546 — the 8-period EMA (thin blue line).
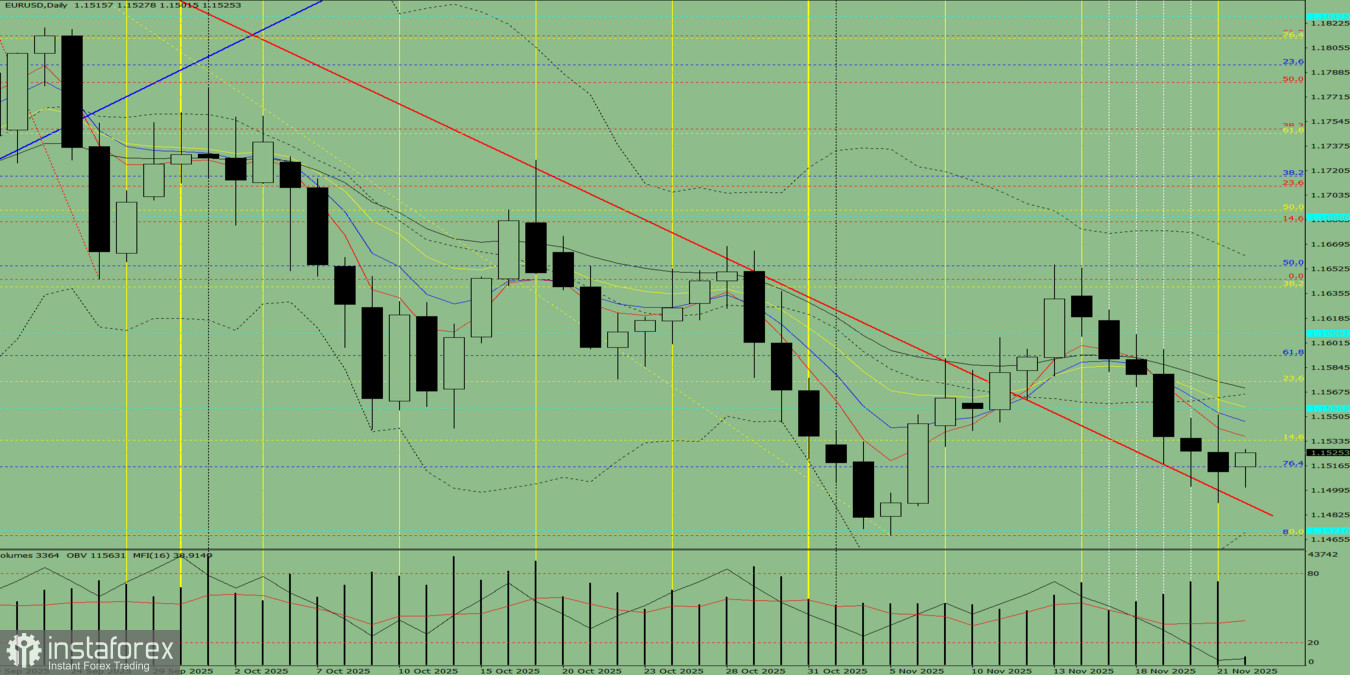
Fig. 1 (daily chart).
Comprehensive Analysis:
- Indicator analysis — upward;
- Fibonacci levels — upward;
- Volumes — upward;
- Candlestick analysis — upward;
- Trend analysis — upward;
- Bollinger Bands — upward;
- Weekly chart — upward.
Overall conclusion: upward trend.
Alternative scenario: From the level of 1.1512 (the close of Friday's daily candle), the price may begin moving upward toward 1.1546 — the 8-period average line (thin blue line).
Upon reaching this line, a pullback downward is possible toward 1.1534 — the 14.6% retracement level (yellow dashed line).


