


Trend Analysis.
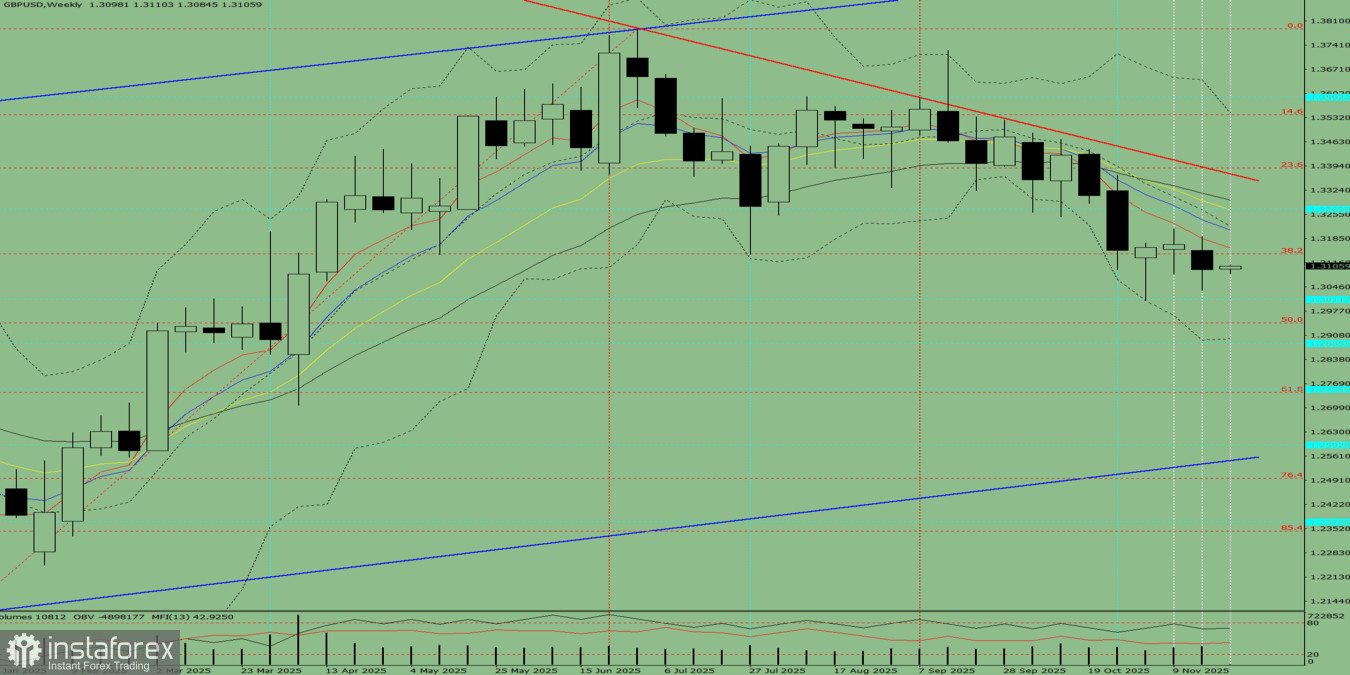
This week, the price at the level of 1.3096 (the closing of the last weekly candle) may begin to move upwards with a target of 1.3270 – a historical resistance level (blue dashed line). When testing this level, the price may pull back down to a target of 1.3224 – the 8-period EMA (blue thin line).
Comprehensive Analysis:
- Indicator analysis – up;
- Fibonacci levels – up;
- Volumes – up;
- Candlestick analysis – up;
- Trend analysis – up;
- Bollinger Bands – up;
- Monthly chart – up.
Conclusion from Comprehensive Analysis: Upward trend.
Overall assessment of the GBP/USD weekly candle calculation: the price is most likely to have an upward trend this week, with the absence of a first lower shadow on the weekly white candle (Monday – upward) and the presence of a second upper shadow (Friday – downward).
Alternative Scenario: The price from the level of 1.3096 (the closing of the last weekly candle) may begin to move upward with a target of 1.3224 – the 8-period EMA (blue thin line). Upon reaching this line, a downward price movement to the target of 1.3142 – the 38.2% retracement level (red dashed line) is possible.


