


Analysis of GBP/USD 5M
The GBP/USD currency pair displayed only "convulsions" again on Monday. Throughout the day, traders attempted to push the British pound above the Ichimoku indicator lines, but they were completely unsuccessful. These lines may eventually be surpassed, but not on Monday. There were no significant macroeconomic or fundamental events to highlight from yesterday, which makes another flat, another "boring Monday," and another instance of low volatility entirely unsurprising. The market not only shows reluctance to trade at this time but also suffers from a lack of drivers on Monday.
From a technical standpoint, the price has surpassed the descending trend line, but this is meaningless if it cannot break through the Ichimoku indicator lines. We saw yet another breach of a downward trend line, yet again, without any "consequences." If the pair cannot consolidate above the Ichimoku indicator lines, downward movement will continue within the daily flat channel of 1.1400-1.1830, despite the trend line breach.
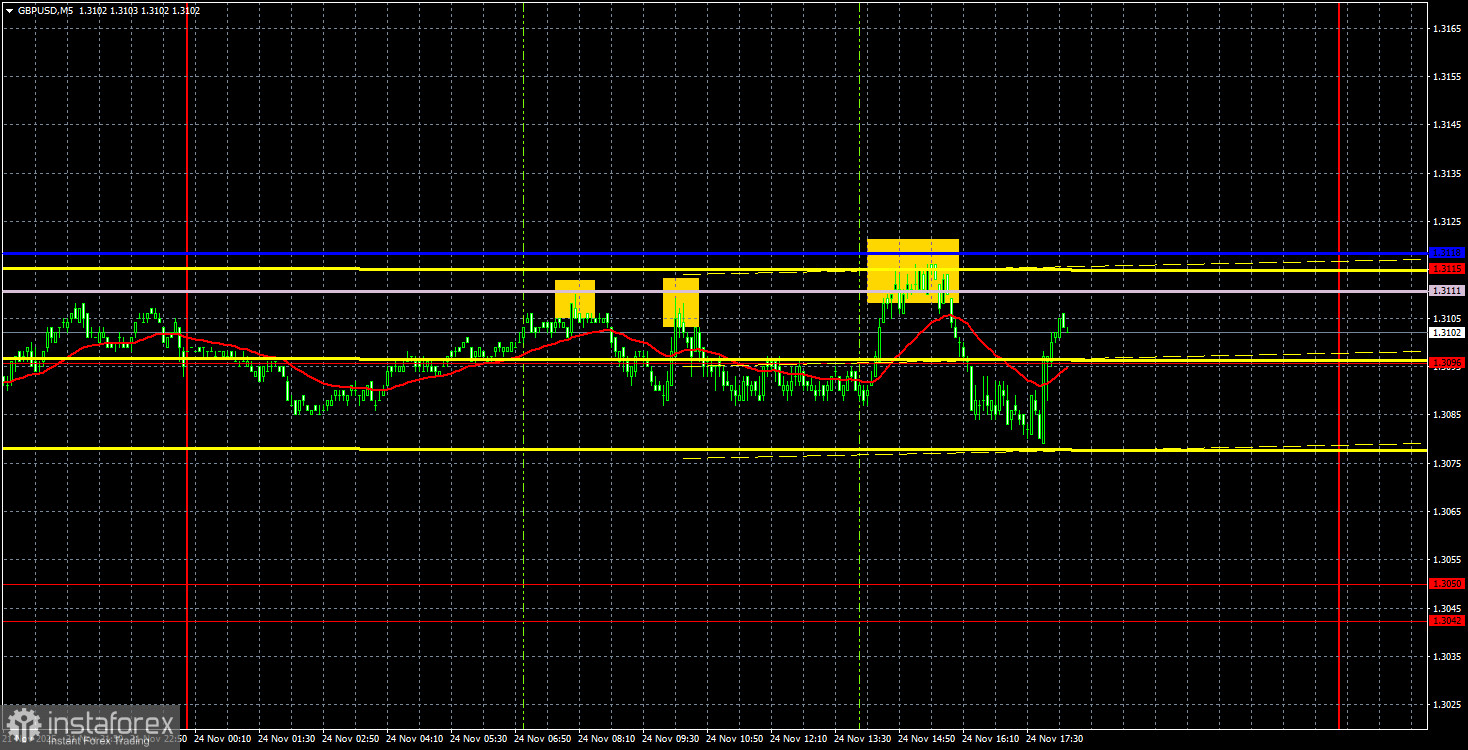
On the 5-minute timeframe, three trading signals for sales were generated yesterday. The price bounced three times from the area of 1.3111-1.3118, each time moving down by no more than 20 pips. Thus, traders had grounds to open trades, but for obvious reasons, the profits were minimal.
COT Report
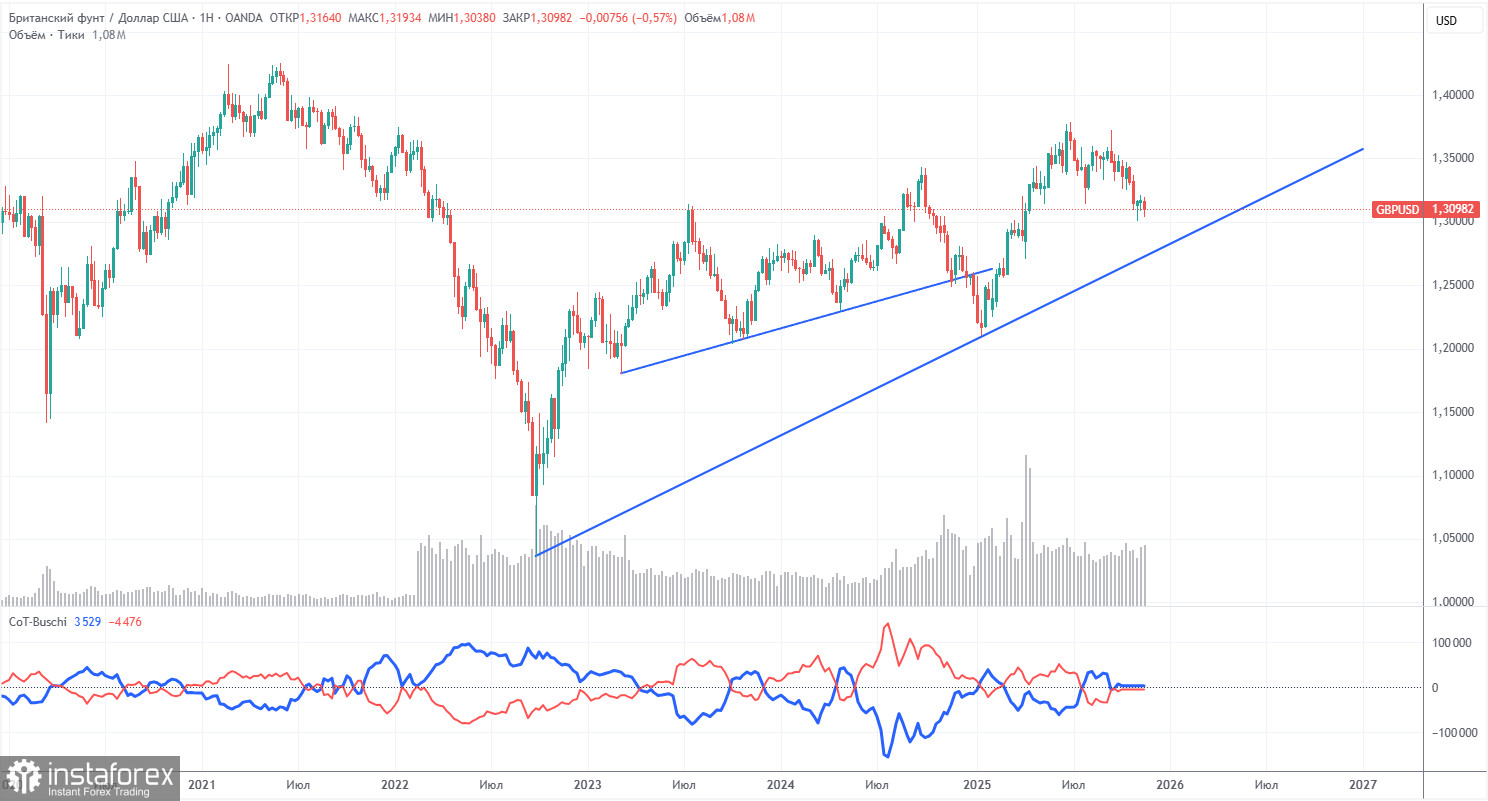
The COT reports for the British pound show that sentiment among commercial traders has fluctuated in recent years. The red and blue lines, which reflect the net positions of commercial and non-commercial traders, frequently cross and are generally close to the zero mark. Currently, they are almost at the same level, indicating a roughly equal number of buy and sell positions.
The dollar continues to decline due to Donald Trump's policies, as shown clearly on the weekly timeframe (illustration above). The trade war will continue in one form or another for a long time. The Federal Reserve will likely lower rates over the next 12 months. Demand for the dollar will consequently decline. According to the last COT report (dated October 7) for the British pound, the "Non-commercial" group opened 13,900 BUY contracts and 9,400 SELL contracts. Thus, the net position of non-commercial traders increased by 4,500 contracts over the week. However, this data is already outdated, and no new data is available.
In 2025, the pound rose significantly, but it should be understood that there is only one reason: Donald Trump's policies. Once this reason is mitigated, the dollar may start to rise, but no one knows when that will happen. The rate of increase or decrease in the net position for the pound (if it decreases) is not significant. For the dollar, that rate is falling in any case and typically at a faster pace.
Analysis of GBP/USD 1H
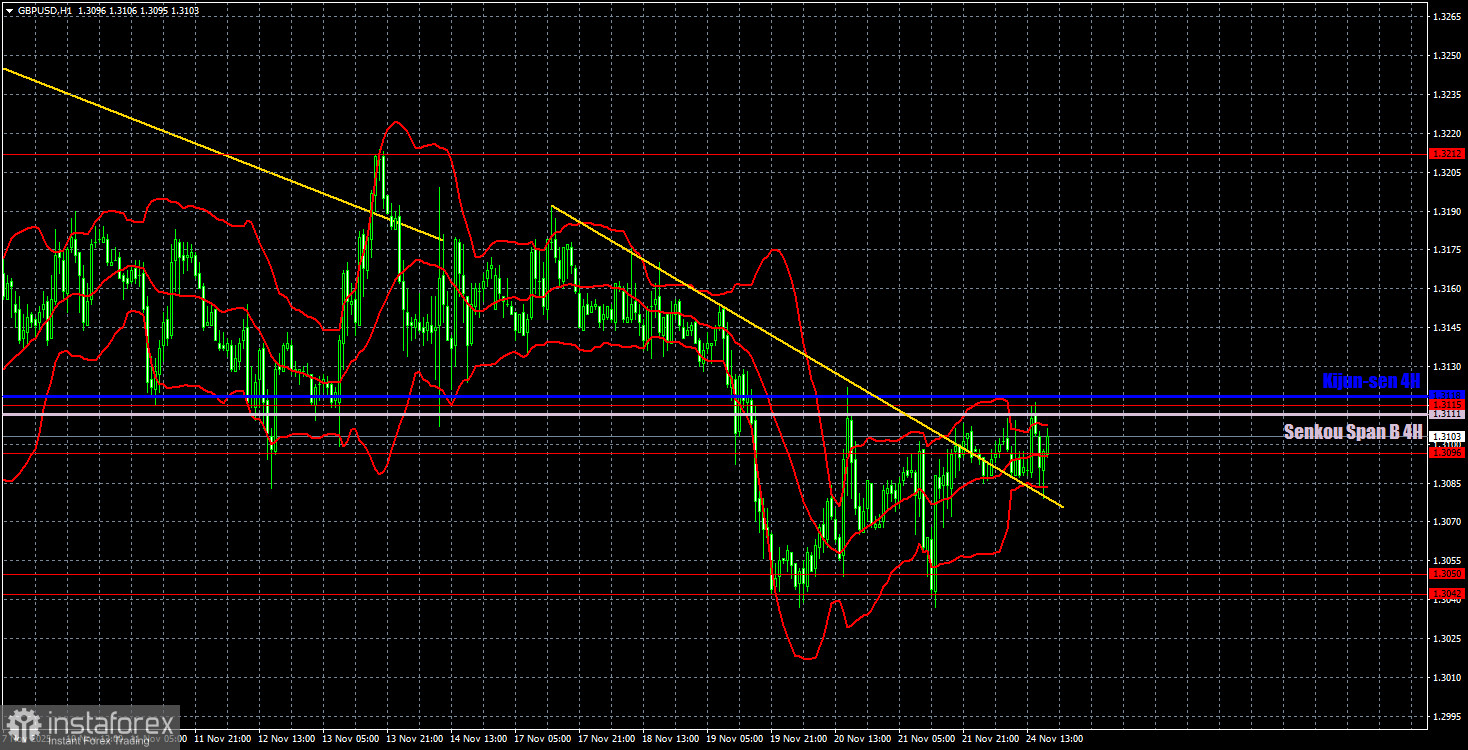
On the hourly timeframe, the GBP/USD pair continues to form a downward trend, as it has not yet been able to consolidate above the Ichimoku indicator lines. Currently, the British pound is trading within a new flat range of 1.3042-1.3115. In the coming weeks, a rise in the British pound can be expected, but such movement requires breaking above the Kijun-sen and Senkou Span B lines, as well as the area of 1.3096-1.3115. We believe that growth in the medium term will resume regardless of the local macroeconomic and fundamental backdrop.
For November 25, we highlight the following important levels: 1.2863, 1.2981-1.2987, 1.3042-1.3050, 1.3096-1.3115, 1.3212, 1.3307, 1.3369-1.3377, 1.3420, 1.3533-1.3548, 1.3584. The Senkou Span B line (1.3111) and Kijun-sen line (1.3118) may also be sources of signals. It is recommended to set a Stop Loss to breakeven if the price moves in the correct direction by 20 pips. The Ichimoku indicator lines may shift during the day, which should be considered when determining trading signals.
On Tuesday, no significant or interesting events are scheduled in the UK, but three relatively important reports will be released in the U.S. It is difficult to say whether this reaction will be sufficient to break through the concrete wall that the pound is currently butting its head against. Volatility may again be low, and the price is unlikely to escape the flat range of 1.3042-1.3115 easily.
Trading Recommendations:
Today, traders may consider selling if the price bounces from the 1.3096-1.3118 area, targeting 1.3042-1.3050. Long positions will become relevant upon consolidation above the Kijun-sen line, targeting 1.3212.
Explanations for the Illustrations:
- Support and resistance price levels are indicated by thick red lines, where price movement may halt. They are not sources of trading signals.
- The Kijun-sen and Senkou Span B lines are lines of the Ichimoku indicator that are transferred from the 4-hour timeframe to the hourly timeframe. They are strong lines.
- Extremum levels are thin red lines from which the price has previously bounced. They are sources of trading signals.
- Yellow lines are trend lines, trend channels, and any other technical patterns.
- Indicator 1 on the COT charts represents the size of the net position of each category of traders.


