


The GBP/USD currency pair remained mostly stagnant on Monday rather than trading actively. However, looking at the events calendar for the first day of the week, all questions dissipate. While the euro had at least the German business climate index at its disposal, the pound and dollar had nothing. There was simply nothing for traders to react to. The American session has traditionally been slightly more volatile than the European session, but overall volatility remains rather mediocre.
On Monday, there was simply nothing to analyze: there were no events, no market movements. The focus now shifts to expectations for the current week. A considerable amount of time need not be spent on this process, as there are no significant events scheduled in the UK and only three to four reports of moderate importance in the U.S. Specifically, the Producer Price Index and retail sales data will be released on Tuesday, along with durable goods orders on Wednesday, and that's about it. The U.S. Bureau of Statistics and other government agencies are just ramping up their work post-shutdown, so they are currently busy collecting and analyzing information from September, or at best, October. These data are already outdated, so even sensational values do not provoke a market reaction.
However, the following week can turn "stormy." We are set to receive current data for October and November on the U.S. labor market and unemployment, as well as the ISM business activity indices for the services and manufacturing sectors. Recall that it will be based on the November data that the Federal Reserve will make its rate decision at the last meeting of the current year. Therefore, these reports will be of immense importance—after all, the September report essentially did not address the question of "What is the current state of the U.S. labor market?"
Currently, the market is expecting further easing of monetary policy from the Fed, but remember that in the first half of the year, the dollar fell sharply despite maintaining its key rate. When the Fed resumed the easing process (in September), the dollar began to appreciate. Thus, the connection between monetary policy and dollar movements is currently quite tenuous.
We still believe that a global correction (or flat) is ongoing in the market, and traders are keeping global factors in mind, which indicate movement in one direction—upward. Even without considering global factors, just looking at the daily timeframe easily answers the question of what trend is currently present. If the trend is upward, then until it is reversed, any drop in quotes is merely a correction. Thus, as before, we anticipate growth in the pound and euro, along with a decline in the dollar. We believe that this strategy will remain relevant through 2026.
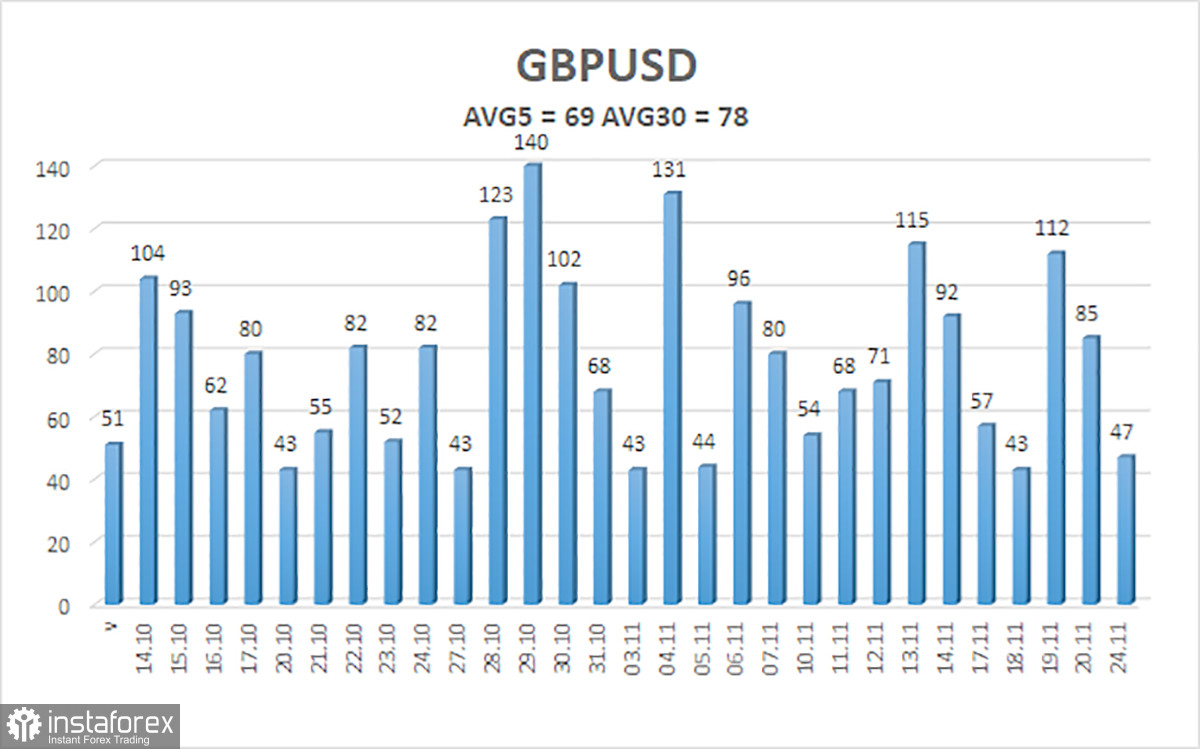
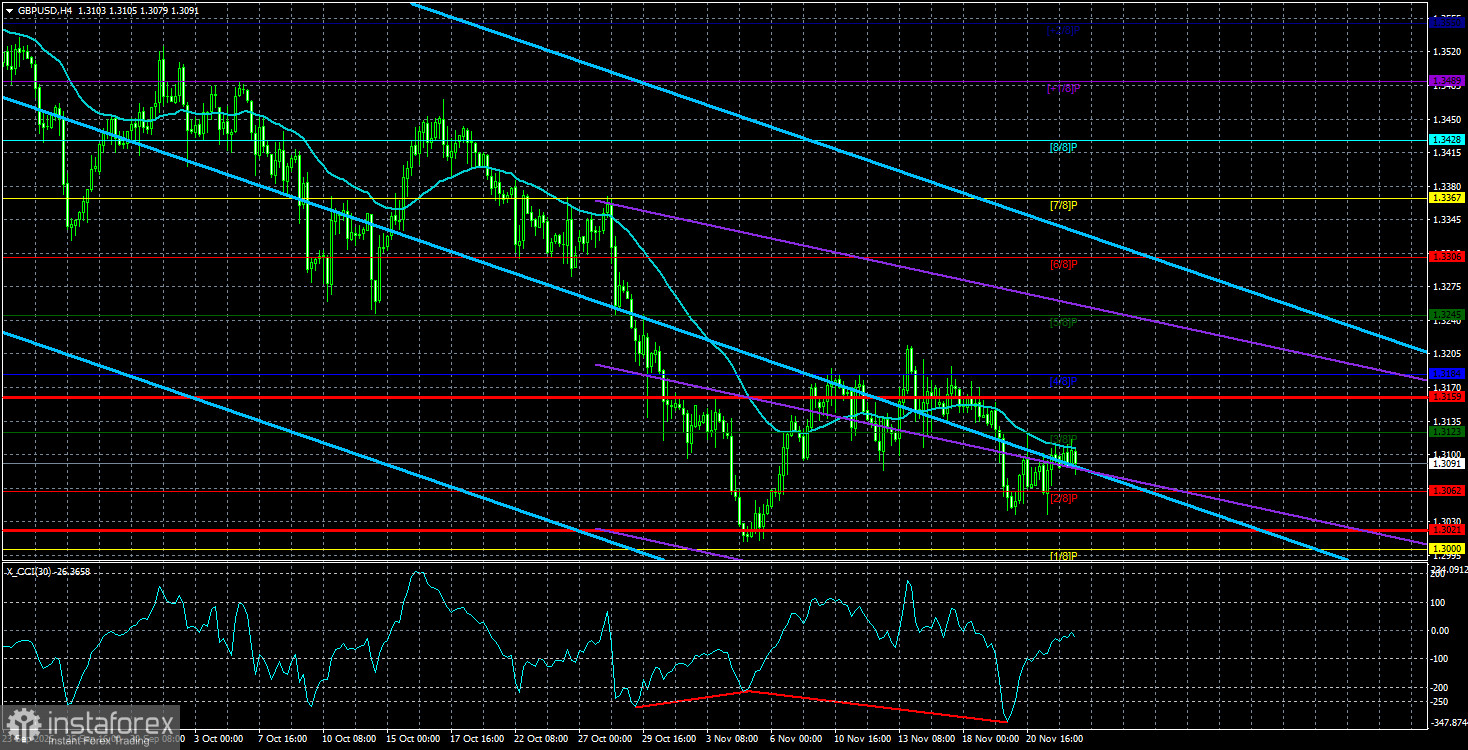
The average volatility of the GBP/USD pair over the last five trading days as of November 25 is 69 pips and continues to decline. For the pound/dollar pair, this value is considered "average." On Tuesday, November 25, we expect movement within the range limited by the levels 1.3021 and 1.3159. The upper channel of linear regression is directed downward, but this is only due to a technical correction on higher timeframes. The CCI indicator has entered the oversold area for the sixth time in recent months and has formed another "bullish" divergence.
Nearest Support Levels:
S1 – 1.3062
S2 – 1.2939
S3 – 1.2817
Nearest Resistance Levels:
R1 – 1.3184
R2 – 1.3306
R3 – 1.3428
Trading Recommendations:
The GBP/USD currency pair is attempting to resume the upward trend of 2025, and its long-term prospects remain unchanged. Donald Trump's policies will continue to exert pressure on the dollar, which is why we do not anticipate growth from the U.S. currency. Therefore, long positions with targets of 1.3306 and 1.3428 remain relevant in the near term if the price is above the moving average. If the price is below the moving average line, small short positions can be considered with a target of 1.3021 on technical grounds. From time to time, the U.S. currency shows corrections (on a global scale), but for a trend to strengthen, it needs real signs of an end to the trade war or other global positive factors.
Explanations for Illustrations:
- Linear regression channels help determine the current trend. If both are directed in the same way, then the trend is currently strong;
- The moving average line (settings 20,0, smoothed) determines the short-term trend and the direction in which trading should currently be conducted;
- Murray levels are targeted levels for movements and corrections;
- Volatility levels (red lines) denote the probable price channel within which the pair will trade in the coming day, based on current volatility metrics;
- The CCI indicator entering the oversold area (below -250) or the overbought area (above +250) indicates that a trend reversal is approaching in the opposite direction.


