


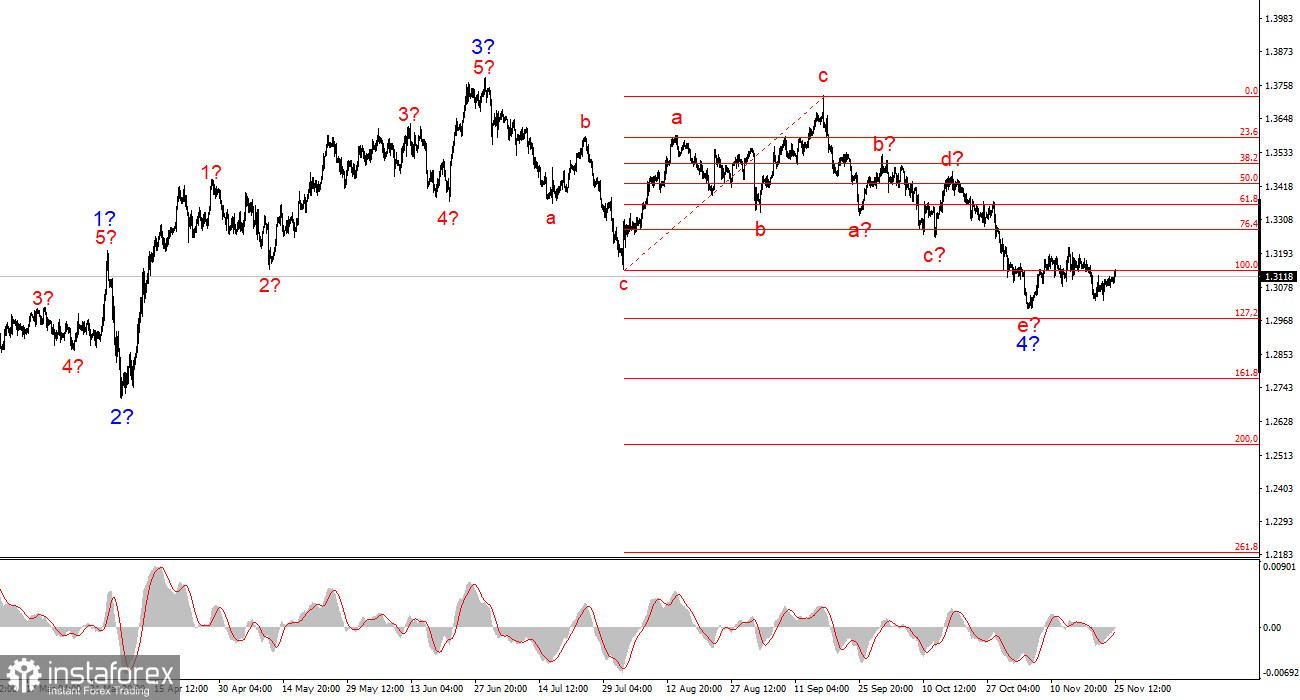
For the GBP/USD pair, the wave pattern continues to indicate the formation of an upward trend segment (bottom chart), but over the past several weeks it has taken on a complex and extended form (top chart). The trend segment that began on July 1 can be considered wave 4, or any global corrective wave, since it has a corrective rather than impulsive internal wave structure. The same applies to its internal sub-waves. Therefore, despite the prolonged decline of the pound, I believe the upward trend remains intact.
The downward wave structure that began on September 17 has taken the shape of a five-wave a-b-c-d-e pattern and may be complete. If this is indeed the case, the pair is now at the very beginning of forming a new upward wave sequence.
Of course, any wave structure can become more complex and extended at any moment. Even the presumed wave 4, which has been forming for almost five months, could take on a five-wave form, in which case the correction would continue for several more months. However, an upward wave sequence may begin forming at this point. If this assumption is correct, we have already seen its first wave, and the second wave may already be complete.
The GBP/USD pair gained 15 basis points on Tuesday. Market movements remain extremely unattractive, which is especially evident on lower-timeframe charts. However, I cannot make the pair move "like in the old days" with a magic wand. Therefore, we simply have to state the fact: movements are currently either weak or complex and inconvenient for traders. The wave pattern continues to become more complicated even on days when it appears straightforward. For example, who now expects the U.S. currency to strengthen if the Fed is sending increasingly dovish signals? Yet the market still refuses to sell the U.S. dollar, which is why GBP/USD is not rising.
During today's U.S. session, at least three reports worthy of attention will be released. The Producer Price Index is interesting because it directly influences the Consumer Price Index, which is extremely important to the Fed. The higher the PPI rises, the higher the CPI will rise. And inflation running higher than market and Fed expectations could force the FOMC committee to reconsider its dovish stance at the December meeting.
The ADP report on weekly employment numbers is interesting because it reflects the state of the labor market, which also greatly concerns the Fed. However, I still believe that the FOMC will wait for the Nonfarm Payrolls for October and November. Therefore, I do not consider ADP an important event.
Retail sales. This is a rather average report that may attract the attention of market participants only if the September reading differs significantly from expectations.
General Conclusions
The wave pattern of the GBP/USD pair has changed. We are still dealing with an upward impulsive trend segment, but its internal wave structure has become complex. The downward corrective a-b-c-d-e structure in wave c of 4 appears fully complete. If this is indeed the case, I expect the main trend segment to resume its formation, with initial targets near the 1.38 and 1.40 levels. In the short term, one can expect the formation of wave 3 or c with targets located around 1.3280 and 1.3360, corresponding to the 76.4% and 61.8% Fibonacci levels.
The larger-scale wave pattern looks almost perfect, even though wave 4 exceeded the peak of wave 1. However, let me remind you that ideal wave patterns exist only in textbooks. In practice, everything is much more complicated. At the moment, I see no reason to consider alternative scenarios to the upward trend segment.
The main principles of my analysis:
- Wave structures should be simple and clear. Complex structures are difficult to trade and often bring changes.
- If you are not confident about what is happening in the market, it is better not to enter it.
- There is no—and can never be—100% certainty in the direction of movement. Do not forget protective Stop Loss orders.
- Wave analysis can be combined with other types of analysis and trading strategies.


