


Are the signals themselves "dovish"? I believe this question should be addressed first. Recently, four members of the FOMC have expressed support for a new round of monetary easing in December. Three of them are well-known: Christopher Waller, Michelle Bowman, and Stephen Miran. It's worth noting that Trump is considering Waller's candidacy for the position of Fed Chair; Trump appointed Bowman and is also vying for the Fed Chair position; and Trump also appointed Miran to replace the resigned Adriana Kugler. As they say, it's clear where the connections lie.
However, last week, another FOMC member, John Williams, the head of the New York Fed, unexpectedly supported a rate cut "in the very near future" (meaning at the December meeting), expressing concern over the cooling U.S. labor market. He stated that the weakness in the labor market supports another round of rate cuts, but that in the future, the central bank will rely on economic statistics. This sounds a bit strange, doesn't it? If economic statistics are the most important, why wait for them before making such statements? After all, Williams was not appointed by Trump...
From all of the above, I would like to note that currently there are only four "doves" on the FOMC. This means that eight other members are prepared to keep the interest rate at its current level if necessary. This "eight" is awaiting economic statistics for October and November, but will not be able to comment on them, as the FOMC meeting is scheduled for December 10 and the "quiet period" begins 10 days before the meeting.
As a result, the market is currently wandering in the dark, unsure of what to expect regarding the Supreme Court's decisions on Trump's tariffs, upcoming reports on the labor market and unemployment, and inflation (which will also be released on December 10). With the release of the necessary data, the Fed will not provide any "hints." Therefore, until December 10, the market may continue to "fumble" in different directions like a blind kitten. However, an "explosion" will occur sooner or later. And hopefully, it will be simply an "explosion," not a "nuclear" one.
Wave Picture for EUR/USD:
Based on the analysis of EUR/USD, I conclude that the instrument continues to build a bullish segment of the trend. In recent months, the market has paused, but Donald Trump's policies and the Fed's remain significant factors in the future decline of the U.S. currency. The current trend targets could extend up to the 25 mark. The bullish wave set may continue to build. I expect that, from the current positions, construction of the third wave of this set will begin, which can be either a simple or a complex formation. At this time, I remain in long positions with targets near the 1.1740 mark, and the upward turn of the MACD indicator offers slight confirmation of these expectations.
Wave Picture for GBP/USD:
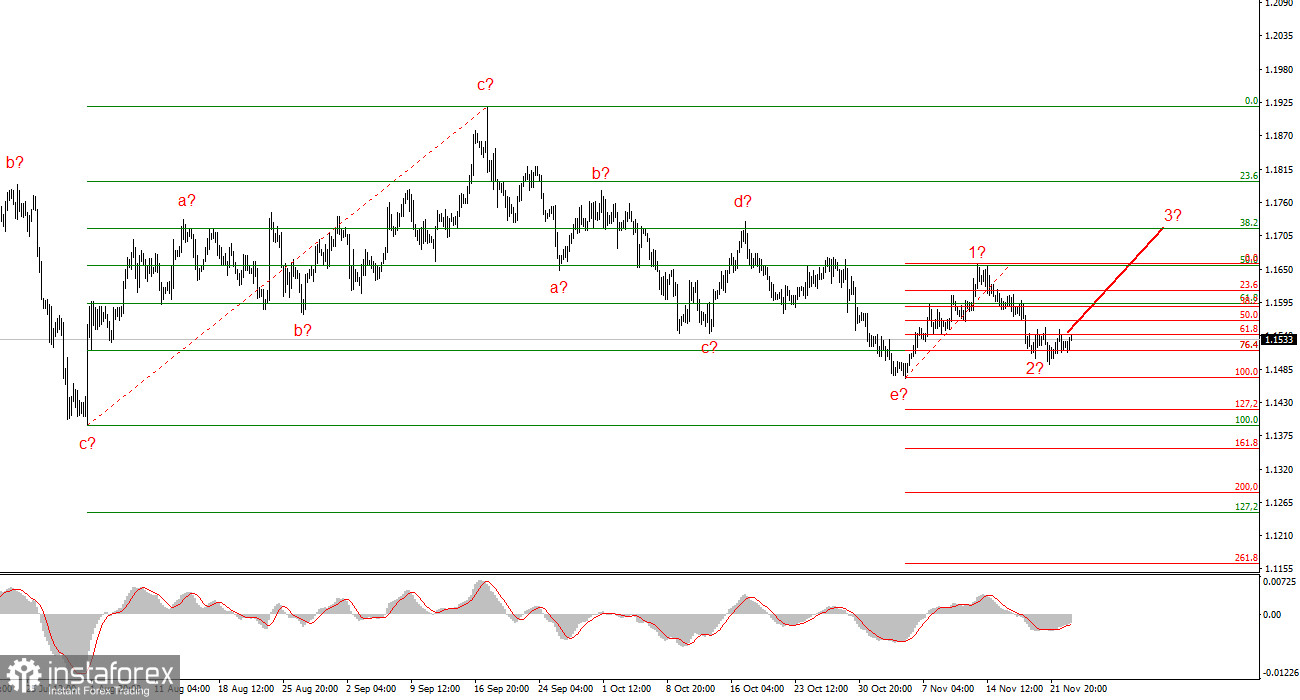
The wave picture for GBP/USD has changed. We continue to deal with an upward, impulsive segment of the trend, but its internal wave structure has become complex. The corrective descending structure a-b-c-d-e in wave 4 appears quite complete. If this is indeed the case, I expect that the main segment of the trend will resume its build-up with initial targets around the 38 and 40 marks. In the short term, a wave 3 or wave c can be expected, with targets around the levels of 1.3280 and 1.3360, which correspond to 76.4% and 61.8% on the Fibonacci scale.
Core Principles of My Analysis:
- Wave structures should be simple and clear. Complex structures are difficult to trade and often undergo changes.
- If there is no confidence in market developments, it is better not to enter the market.
- There is no 100% certainty about the direction of movement, nor can there ever be. Remember to use protective stop-loss orders.
- Wave analysis can be combined with other types of analysis and trading strategies.


