


Trend Analysis (Fig. 1).
On Wednesday, from the level of 1.3161 (yesterday's daily candle close), the market may possibly continue its upward movement toward 1.3232 — the historical resistance level (light blue dashed line). Upon testing this level, the price may pull back downward toward 1.3178 — the 23.6% pullback level (blue dashed line).
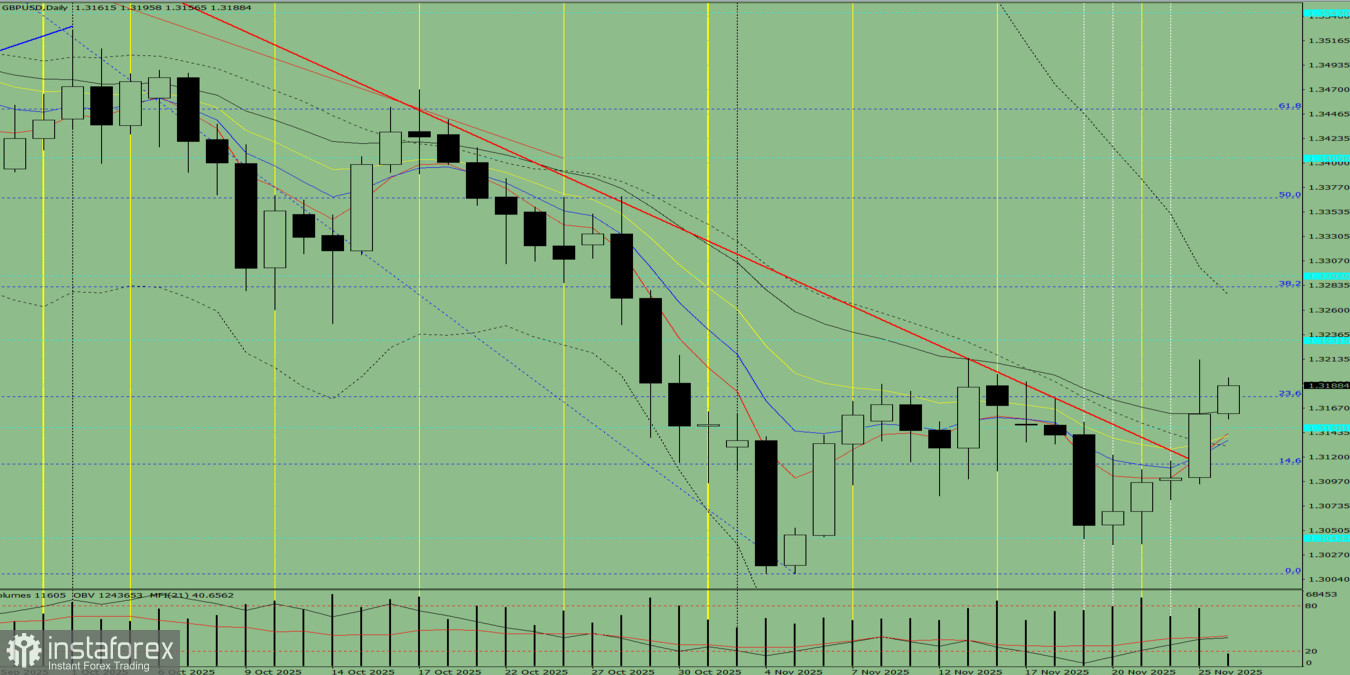
Fig. 1 (daily chart).
Comprehensive Analysis:
- Indicator analysis – upward
- Fibonacci levels – upward
- Volume – upward
- Candlestick analysis – upward
- Trend analysis – upward
- Bollinger Bands – upward
- Weekly chart – upward
Overall conclusion: upward trend.
Alternative scenario: On Wednesday, from the level of 1.3161 (yesterday's daily candle close), the market may possibly continue moving upward toward 1.3213 — the upper fractal (daily candle of November 25, 2025). Upon testing this level, the price may pull back downward toward 1.3178 — the 23.6% pullback level (blue dashed line).


