


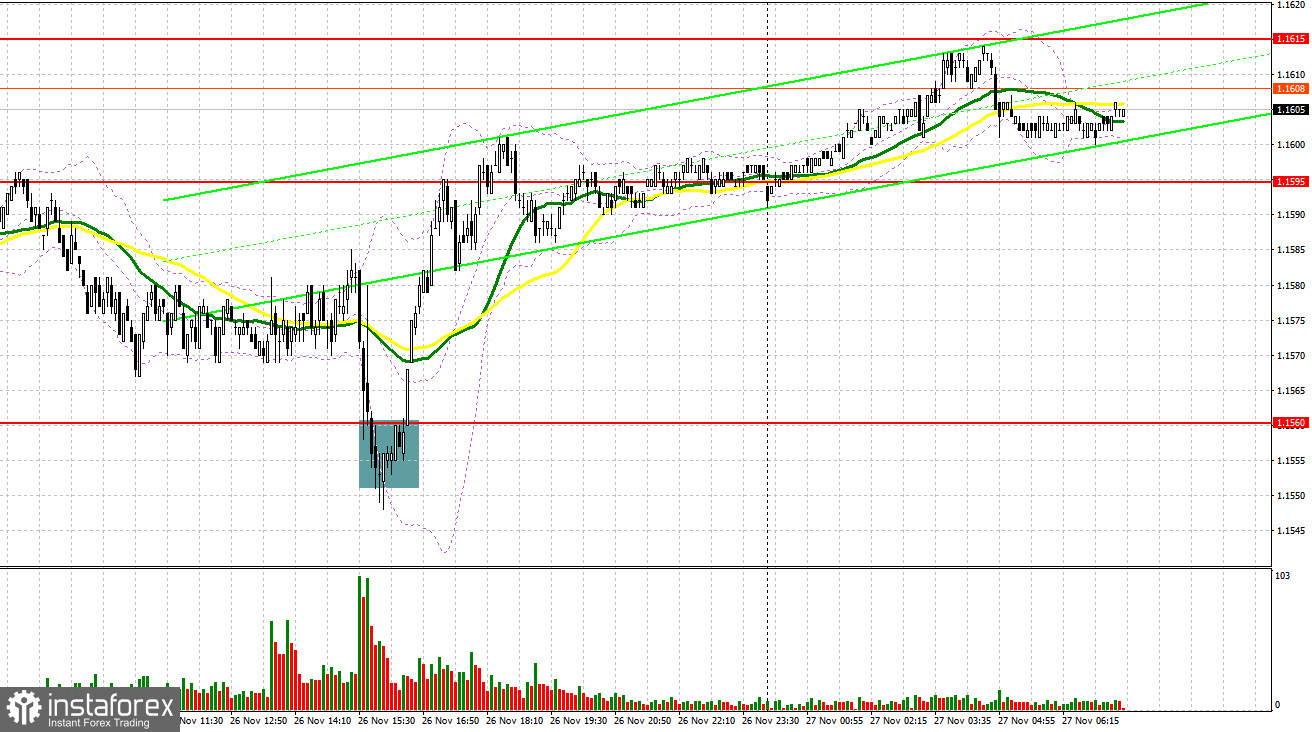
On Wednesday, the EUR/USD pair experienced several suitable entry points into the market. Let's take a look at the 5-minute chart to understand what transpired. In my morning forecast, I focused on the 1.1576 level and planned to base my trading decisions on it. The drop and formation of a false breakout around 1.1576 provided a buying opportunity for the euro; however, the pair did not show significant gains. In the second half of the day, long positions based on a false breakout from 1.1560 allowed for re-entry into long positions, resulting in a rise of more than 40 pips.
For Opening Long Positions on EUR/USD:
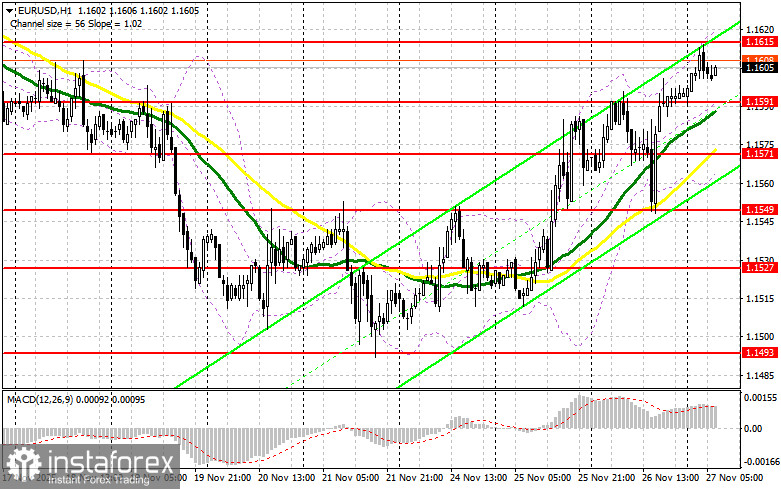
The data on the decline in initial jobless claims in the U.S. provided some support to the dollar, but the risks of further rate cuts from the Federal Reserve outweighed this, leading to another weakening of the dollar. A lot of reports are expected today in the first half of the day. It will start with the GfK consumer climate leading indicator from Germany, as well as statistics on private sector lending in the Eurozone and changes in the M3 money supply. It will conclude with the European Central Bank report from the monetary policy meeting, where the central bank kept interest rates unchanged. Given the bullish trend for the euro, it is best to act on declines. I expect the first manifestation of buyers around the support level of 1.1591, formed by yesterday's results. A false breakout there will provide a point for entering long positions with a target for recovery to the resistance level of 1.1615. A breakout and subsequent retest of this range will confirm the correct course of action for buying euros in anticipation of a larger surge towards 1.1635. The furthest target will be around 1.1655, where I will take profits. Testing this level will strengthen the bullish market for the euro. In the event of a decline in EUR/USD and the absence of activity around 1.1591, selling pressure will increase, leading to movement towards the next interesting level at 1.1571. Only the formation of a false breakout there will be a suitable condition for buying euros. I plan to open long positions immediately on a bounce from the low at 1.1549, targeting an intraday correction of 30-35 pips.
For Opening Short Positions on EUR/USD:
Sellers attempted to enter the market yesterday, but it is clear that bullish sentiment remains. In the event of strong data from the Eurozone, the euro's growth will continue. Therefore, I expect the first appearance of sellers today only near the resistance level of 1.1615. The formation of a false breakout there will provide an entry point for short positions targeting a move down to the support level of 1.1591, which is an intermediate level. A breakout and retest below this range will create another suitable entry for short positions, with a move towards 1.1571, where the moving averages favor the bulls. The furthest target will be the 1.1549 area, where I will take profits. In the event of further EUR/USD growth and the absence of selling at 1.1615, buyers will have a good opportunity for another surge. In that case, short positions are best postponed until the larger level of 1.1635 is reached. Selling there will only occur after a failed consolidation. I plan to open short positions immediately on a bounce from 1.1655, with the aim of a downward correction of 30-35 pips.
Recommended for Review:
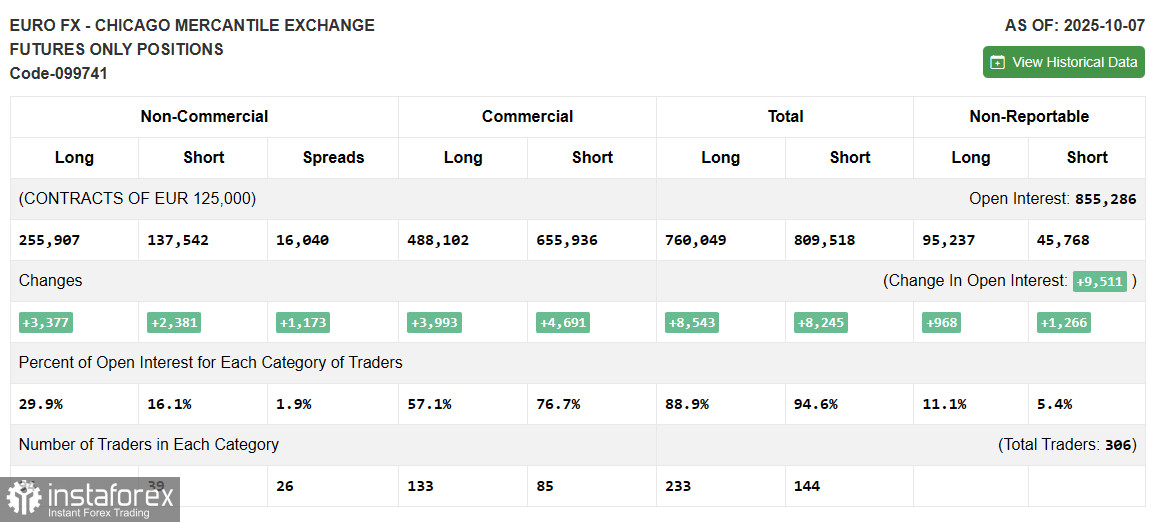
Due to the shutdown in the U.S., fresh data on Commitment of Traders (COT) is not being published. As soon as the current report is prepared, we will publish it immediately. The last relevant data is from October 7.
In the COT report, short positions have decreased and long positions have increased. The pressure on the dollar continues—especially after the latest data, which will likely compel the Federal Reserve to keep lowering interest rates. However, the number of euro buyers is also not increasing. The COT report indicates that non-commercial long positions decreased by 789 to 252,472, while non-commercial short positions rose by 2,625 to 138,625. As a result, the spread between long and short positions narrowed by 873.
Indicator Signals:
Moving Averages
- Trading is taking place above the 30 and 50-day moving averages, indicating potential further growth for the pair.
Note: The period and prices of the moving averages are examined by the author on the hourly chart (H1), which differs from the general definition of classic daily moving averages on the daily chart (D1).
Bollinger Bands
- In case of a decline, the lower boundary of the indicator around 1.1560 will serve as support.
Description of Indicators:
- Moving Average (MA): Determines the current trend by smoothing out volatility and noise. Period – 50. Highlighted in yellow on the chart.
- Moving Average (MA): Determines the current trend by smoothing out volatility and noise. Period – 30. Highlighted in green on the chart.
- MACD Indicator (Moving Average Convergence/Divergence): Fast EMA – period 12. Slow EMA – period 26. SMA – period 9.
- Bollinger Bands: Period – 20.
- Non-commercial Traders: Speculators such as individual traders, hedge funds, and large institutions that use the futures market for speculative purposes, meeting certain requirements.
- Long Non-commercial Positions: The total long open position of non-commercial traders.
- Short Non-commercial Positions: The total short open position of non-commercial traders.
- Total Non-commercial Net Position: The difference between the short and long positions of non-commercial traders.


