


Trade Analysis for Thursday:
1H Chart of the GBP/USD Pair

The GBP/USD pair corrected slightly on Thursday, retracing from Wednesday's highs. There were no macroeconomic or fundamental factors present, so traders found no grounds for new purchases of the British currency, which has been struggling to rise as of late. We continue to believe that a global downward correction is underway on the daily timeframe, and therefore, expect its completion and the resumption of the upward trend. The UK budget is no longer exerting pressure on the British pound, as it has already been accepted and the market has successfully absorbed its negative aspects over the past two months. However, December is approaching, which means that the market will finally learn the labor market, unemployment, and inflation data for October and November. This data could serve as a starting point for a new prolonged decline of the American currency, as we reiterate that a global upward trend remains in place.
5M Chart of the GBP/USD Pair
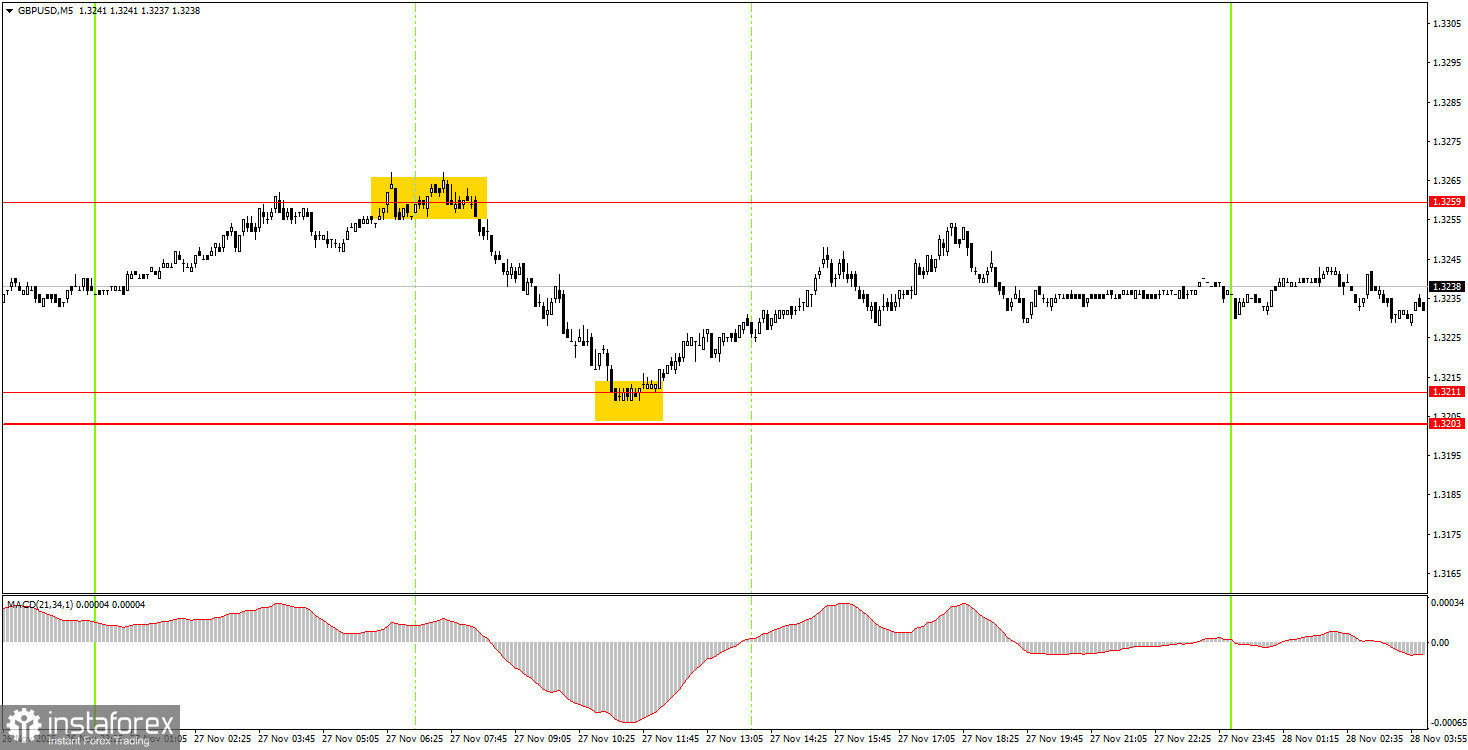
On the 5-minute timeframe, two trading signals were formed yesterday. At the very beginning of the European trading session, the price bounced off the 1.3259 level, then dropped to the 1.3203-1.3211 area over several hours. Thus, novice traders could open short positions that yielded about 30 pips in profit. The bounce from the area of 1.3203-1.3211 was a buy signal and could also have been worked on. For the remainder of the day, the pair only rose, meaning that the trade could have been closed with a profit of 20-25 pips.
How to Trade on Friday:
On the hourly timeframe, the GBP/USD pair has completed another downward trend. An upward movement has begun, and we hope that it will not end as quickly as all previous trends on the hourly timeframe. As we mentioned, there are no global reasons for a prolonged rise in the dollar, so in the mid-term, we expect movement only to the upside. The correction/flat on the daily timeframe may not yet be complete, but any local trend on the hourly timeframe is potentially a resumption of the global trend.
On Friday, novice traders can expect the formation of new trading signals near the level of 1.3259 or in the area of 1.3203-1.3211. Movements today may once again be weak, as there will be a lack of macroeconomic context.
On the 5-minute timeframe, trading can currently occur at the levels of 1.2913, 1.2980-1.2993, 1.3043, 1.3096-1.3107, 1.3203-1.3211, 1.3259, 1.3329-1.3331, 1.3413-1.3421, 1.3466-1.3475, 1.3529-1.3543, and 1.3574-1.3590. On Friday, no important events or reports are scheduled in the UK or the US. Thus, volatility may be at a standstill today.
Key Principles of My Trading System:
- The strength of the signal is considered based on the time taken to form the signal (bounce or breach of a level). The less time taken, the stronger the signal.
- If two or more trades have been opened around a certain level based on false signals, all subsequent signals from that level should be ignored.
- In a flat market, any pair can create numerous false signals or may not form them at all. In any case, it's best to stop trading at the first signs of a flat.
- Trading deals are opened during the period between the start of the European session and the middle of the American session, after which all deals should be closed manually.
- On the hourly timeframe, it is preferable to trade based on signals from the MACD indicator only when there is good volatility and a trend that is confirmed by a trend line or trend channel.
- If two levels are too close to each other (between 5 and 20 pips), they should be treated as an area of support or resistance.
- After a 20-pip move in the right direction, a Stop Loss should be set to breakeven.
What the Charts Show:
- Support and resistance price levels are targets for opening buy or sell positions. Take Profit levels can be placed around them.
- Red lines indicate trend channels or trend lines, reflecting the current trend and indicating the preferred trading direction.
- The MACD indicator (14,22,3) — histogram and signal line — is a supplementary indicator that can also be used as a source of signals.
Important announcements and reports (always available in the news calendar) can significantly impact the movement of the currency pair. Therefore, during their release, it is recommended to trade with maximum caution or to exit the market to avoid sharp reversals against the preceding movement.
Beginners trading on the Forex market should remember that not every trade can be profitable. Developing a clear strategy and money management is key to long-term success in trading.


