


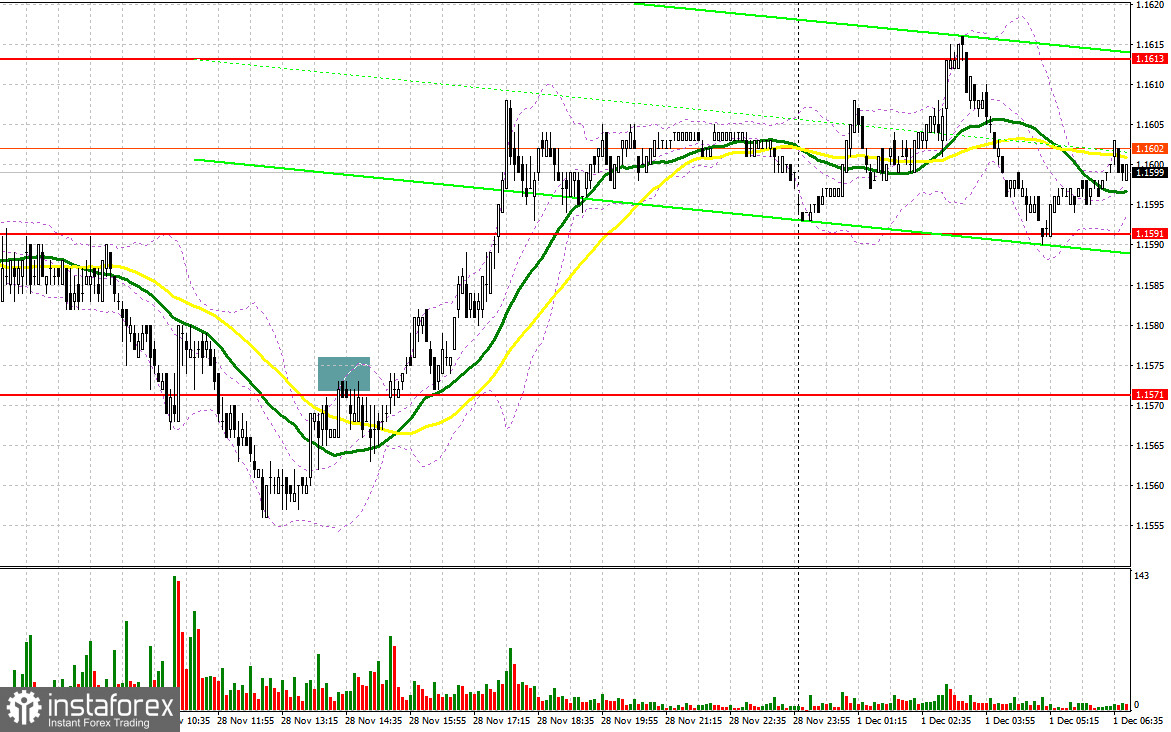
Last Friday, several entry points into the market were formed. Let's take a look at the 5-minute chart and analyze what happened. In my morning forecast, I pointed out the level of 1.1571 and planned to make entry decisions based on it. The decline and formation of a false breakout near 1.1571 provided a buying point for the euro; however, after the pair rose by 10 pips, selling pressure on the euro returned. In the second half of the day, a false breakout near 1.1571 prompted selling of the European currency, but it did not trigger significant downward movement.
To Open Long Positions on EUR/USD:
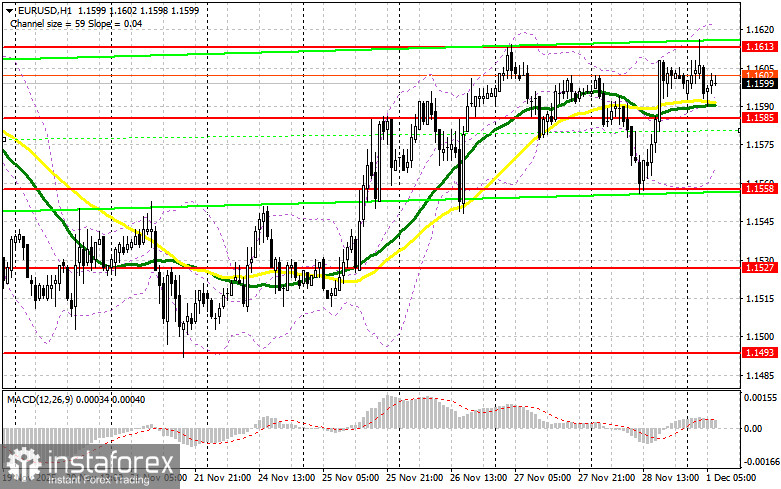
The absence of U.S. data helped the euro recover against the dollar. Today, in the first half of the day, data is expected on the manufacturing sector business activity index for Germany, France, and the Eurozone. It is worth noting that the manufacturing sector has been the laggard this year, and today's data is unlikely to sustain the European currency's rise. In the case of weak data, I expect the first signs of buyers to arise around 1.1585 – support established at the end of last Friday. A false breakout there will provide a point of entry for long positions, targeting a recovery of the pair to resistance at 1.1613, above which it has yet to break through. A breakout and a retest of this range will confirm the right actions to buy euros, aiming for a larger surge to 1.1635. The furthest target will be the peak at 1.1655, where I will take profits. Testing this level will strengthen the bullish market for the euro. If EUR/USD declines and there is no activity around 1.1585, pressure on the pair will increase at the beginning of the month. Sellers will likely reach the next interesting level at 1.1558. Only a false breakout there will constitute a fitting condition to buy euros. Long positions will be opened immediately on the rebound from 1.1527 with a target of an upward correction of 30-35 pips intraday.
To Open Short Positions on EUR/USD:
Sellers are currently acting with caution, as the likelihood of a more accommodative policy from the Federal Reserve increases each day. If the pair rises in the first half of the day, the first sign of sellers is expected only around the 1.1613 resistance level, which serves as the upper boundary of the sideways channel. A false breakout there will provide an entry point for short positions, targeting a move toward support at 1.1585, where the moving averages are on the bulls' side. A breakout and consolidation below this range, along with a retest from below, will present another suitable option to open short positions, aiming for the area around 1.1558. The furthest target will be the 1.1527 area, where I will take profits.
If EUR/USD moves higher and there is a lack of active bearish action around 1.1613, buyers will have a good opportunity to continue the bullish market. In that case, it is best to postpone short positions until the larger level of 1.1635. Selling there will only occur after an unsuccessful consolidation. I plan to open short positions immediately on a rebound from 1.1655 with the goal of a downward correction in the range of 30-35 pips.
Recommendations for Review:
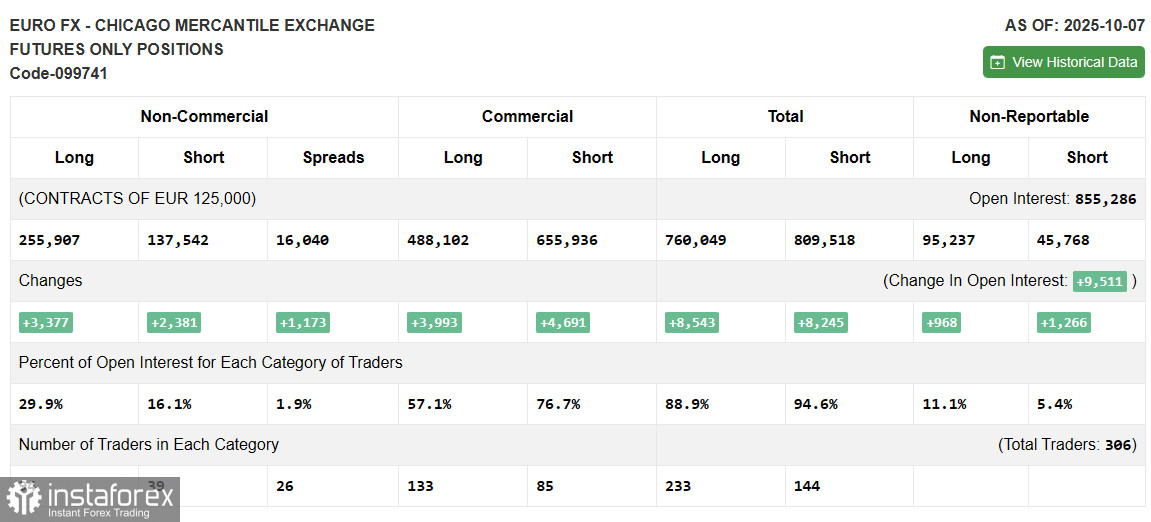
Due to the shutdown in the U.S., fresh data on the Commitment of Traders is not being published. As soon as the updated report is prepared, we will release it. The latest available data is from October 7.
In the COT report (Commitment of Traders), an increase in both long and short positions was observed. Expectations for further interest rate cuts by the Federal Reserve continue to exert pressure on the U.S. dollar. However, there aren't more buyers of the euro either. The COT report shows that non-commercial long positions decreased by 789 to 252,472, while non-commercial short positions increased by 2,625 to 138,625. As a result, the spread between long and short positions has decreased by 873.
Indicator Signals:
Moving Averages:
Trading is currently occurring around the 30 and 50-day moving averages, indicating market uncertainty concerning direction.
Note: The period and prices of moving averages are considered by the author on the H1 hourly chart and differ from the general definition of classic daily moving averages on the D1 daily chart.
Bollinger Bands:
In the event of a decline, the indicator's lower boundary around 1.1565 will serve as support.
Indicator Descriptions:
- Moving Average (MA): Defines the current trend by smoothing out volatility and noise. Period – 50. Marked in yellow on the chart.
- Moving Average (MA): Defines the current trend by smoothing out volatility and noise. Period – 30. Marked in green on the chart.
- MACD Indicator (Moving Average Convergence/Divergence): Fast EMA – period 12. Slow EMA – period 26. SMA – period 9.
- Bollinger Bands: Period – 20.
- Non-Commercial Traders: Speculators, such as individual traders, hedge funds, and large institutions, using the futures market for speculative purposes and meeting specific requirements.
- Long Non-Commercial Positions: Total long open position of non-commercial traders.
- Short Non-Commercial Positions: Total short open position of non-commercial traders.
- Total Non-Commercial Net Position: The difference between short and long positions of non-commercial traders.


