


Trend Analysis
In December, from the level of 1.3232 (the close of the November monthly candle), the price may begin moving downward toward 1.2886 — the historical resistance level (blue dashed line). When testing this level, the price may rebound upward toward 1.2942 — the 50% retracement level (red dashed line).
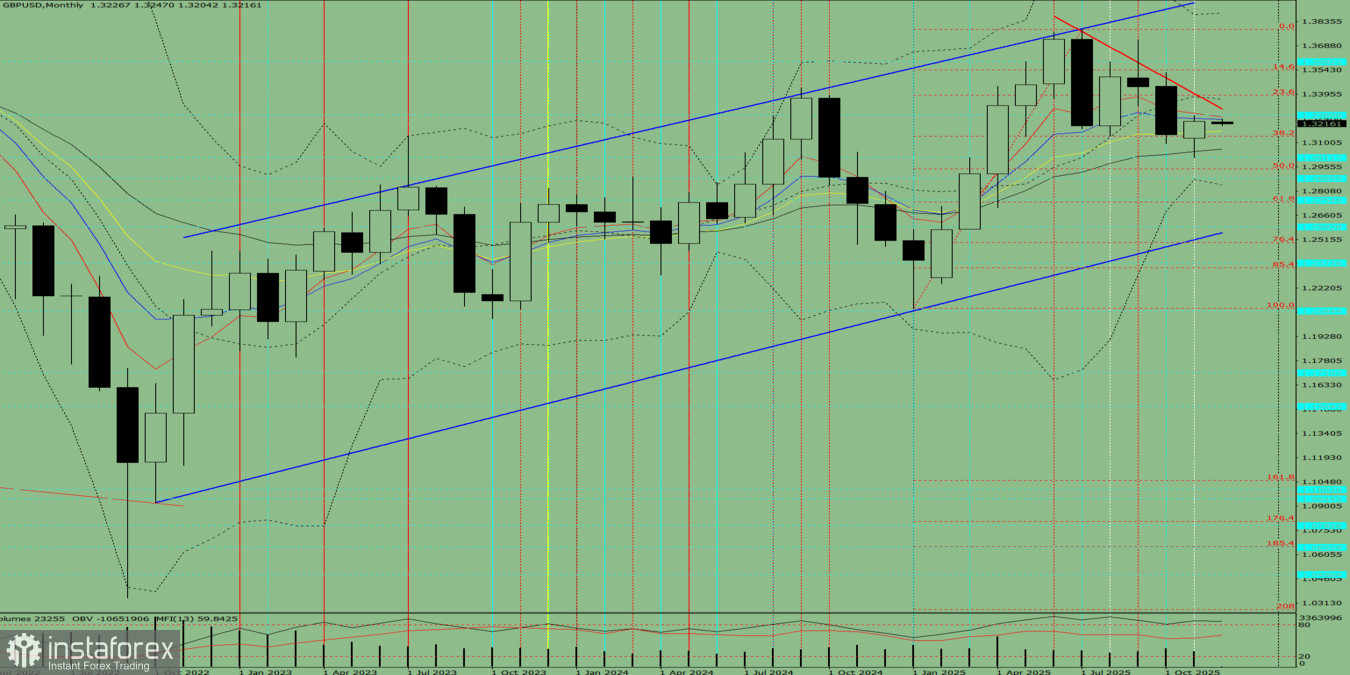
Fig. 1 (Monthly Chart).
Indicator Analysis:
- Indicator analysis — downward
- Fibonacci levels — downward
- Volume — downward
- Candlestick analysis — downward
- Trend analysis — downward
- Bollinger Bands — downward
Conclusion from comprehensive analysis: a downward trend is possible.
Overall Summary for the Monthly GBP/USD Candle:
The price will most likely show a downward tendency, with the monthly bearish candle lacking the first upper shadow (first week of the month — bearish) and having the second lower shadow (last week of the month — bullish).
Alternative Scenario:
From the level of 1.3232 (the close of the November monthly candle), the price may begin moving downward toward 1.3012 — the historical support level (blue dashed line). When testing this level, the price may rebound upward toward 1.3139 — the 38.2% retracement level (red dashed line).


