


For GBP/USD, the wave pattern continues to indicate the formation of an upward trend segment (bottom chart), although in recent weeks it has taken on a complex and extended form (top chart). The trend segment that began on July 1 can be considered wave 4, or any global corrective wave, since it has a corrective rather than impulsive internal wave structure. The same applies to its internal subwaves. Therefore, despite the prolonged decline of the British currency, I believe the upward trend remains intact.
The downward wave structure that began on September 17 has taken the form of a five-wave pattern a–b–c–d–e and may be complete. If this is indeed the case, the instrument is now in the process of forming a new upward set of waves.
Of course, any wave structure can become more complex and take on a more extended form at any moment. Even the presumed wave 4, which has been forming for almost five months now, may still develop into a five-wave structure, in which case we could see several more months of correction. However, at the moment, the market has every chance to build an upward wave sequence. If this is the case, the first two waves of this segment are already complete, and we are now observing the formation of wave 3 or c.
The GBP/USD exchange rate remained largely unchanged during the first half of Monday, but market activity may pick up during the US session, and demand for the US dollar may continue to decline. GBP/USD has formed what at first glance appears to be a rather complex corrective structure, but at the same time it looks convincing and leaves little room for alternative interpretation. Therefore, in the near future, we can expect the formation of an upward wave sequence. Unfortunately, the current corrective structure may not be complete and could still become much more extended. This scenario is not the base case, but it cannot be entirely ruled out.
The US dollar is currently pressured by the upcoming Fed meeting. According to the CME FedWatch tool, markets are 87% confident in a rate cut on December 10. In fact, news for the US currency has remained weak, negative, or "bearish" in recent months as well, but the market chose to use this time not for further dollar selling, but for a complex correction. As a result, demand for the US dollar often increased even when the news background did not justify such behavior. If UK statistics stop falling every month, this will support buyers. I repeat: in my view, GBP/USD has fallen too far over the past months. I expect a recovery, supported by both wave analysis and the news background.
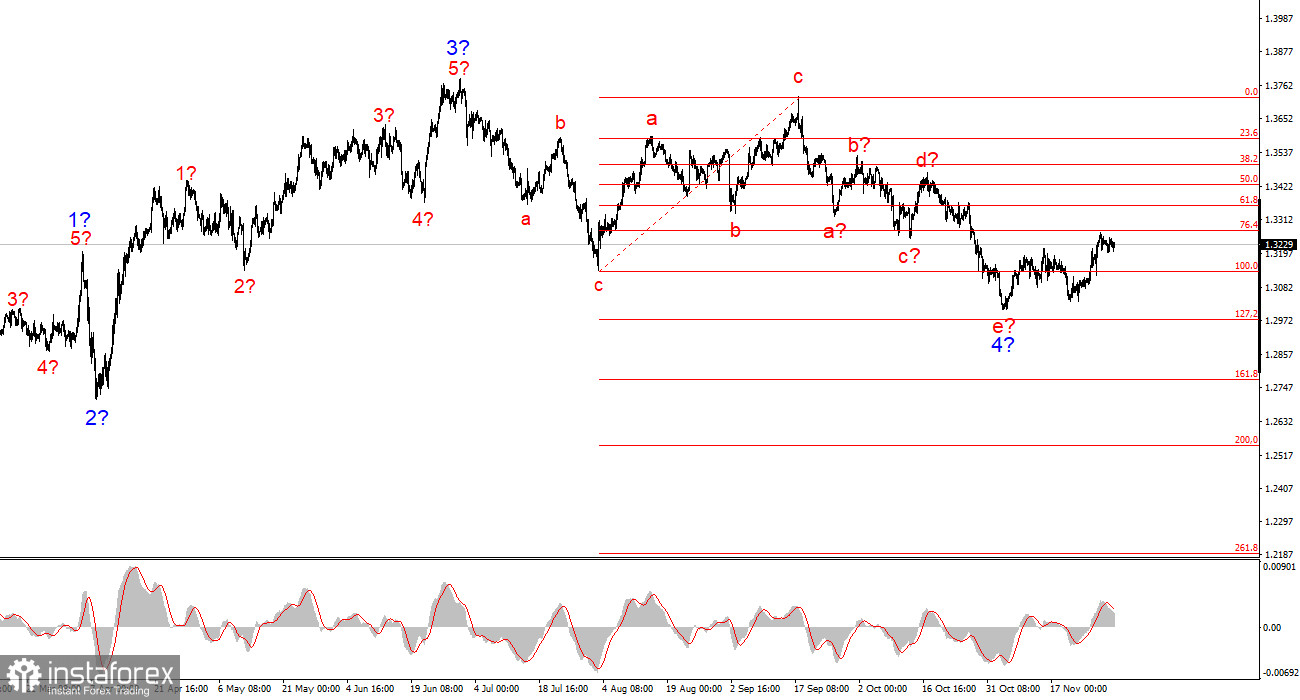
General Conclusions
The wave pattern of GBP/USD has changed. We are still dealing with an upward impulsive trend segment, but its internal wave structure has become complex. The downward corrective structure a–b–c–d–e in c in 4 appears largely complete. If this is indeed the case, I expect the main trend segment to resume with initial targets around the 1.38 and 1.40 levels. In the short term, one may expect the formation of wave 3 or c with targets around 1.3280 and 1.3360, corresponding to the 76.4% and 61.8% Fibonacci levels. These are the minimum targets if the market decides to complicate wave 4 even further.
The larger-scale wave structure looks nearly ideal, even though wave 4 crossed above the peak of wave 1. However, let me remind you that perfect wave structures exist only in textbooks. In practice, everything is much more complicated. At the moment, I see no grounds to consider alternative scenarios to the upward trend segment.
Key principles of my analysis:
- Wave structures should be simple and clear. Complex structures are difficult to trade and often lead to changes.
- If there is no confidence in what is happening in the market, it is better not to enter it.
- One can never have 100% certainty about market direction. Do not forget about protective Stop Loss orders.
- Wave analysis can be combined with other forms of analysis and trading strategies.


