


The GBP/USD currency pair rose on Monday, despite a lack of support from the macroeconomic backdrop. Only one significant report was published yesterday—the ISM manufacturing activity index in the U.S. This report did not please traders; however, the dollar was already showing weakness before this figure was released. Monday often tends to be dull, and this time, volatility was also low. Overall, the market has been trading hesitantly for the past few months, and this trend continues.
We maintain a positive outlook for further growth. Recall that in recent months, a global correction has been underway against the upward trend of 2025, a trend we anticipated would be completed much earlier. This correction has proven to be quite complex, prolonged, and substantial. Unlike the euro, the British pound has corrected nearly 50% according to Fibonacci levels. While the euro has been flat for five months, the pound has undergone a full downward correction. However, both a flat and a correction will eventually come to an end, and we believe that the pair may now be at the beginning of a new phase of the global trend. Of course, we can't be 100% certain, but what factors does the dollar have for further growth when there have been no favorable indicators in recent months?
Negative pressure on the pound arose from news about the British budget. While we do not believe this issue warrants regular sell-offs of the British pound, during which the market completely ignored all news from the U.S., which itself had been largely negative, it is fair to acknowledge that the market had the right to sell the pound more aggressively than the euro. Additionally, the Bank of England has not yet completed its monetary easing, unlike the European Central Bank. This is why the pound has shown a more significant correction and decline in recent months.
However, in the long run, we remain focused solely on growth. If next year Donald Trump renews pressure on FOMC members, the dollar may begin to decline more sharply. The Federal Reserve will continue to ease monetary policy regardless, as there is no alternative under Trump. The chair of the Fed will change in May, and it is evident that the new chair will support lowering the key interest rate. Thus, the dollar may avoid falling in the second half of 2025, but its prospects remain uncertain. After all, no one knows what decisions Trump will make next year, and the market is keen to sell the dollar in response to the American president's protective actions.
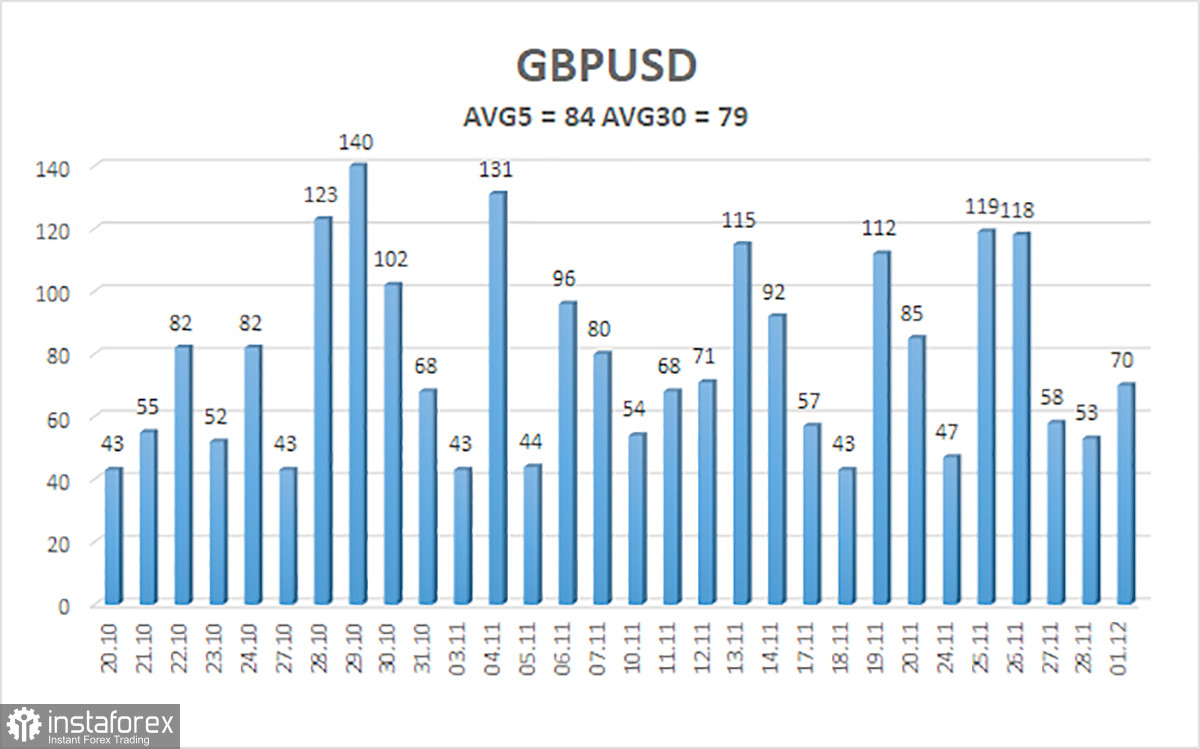
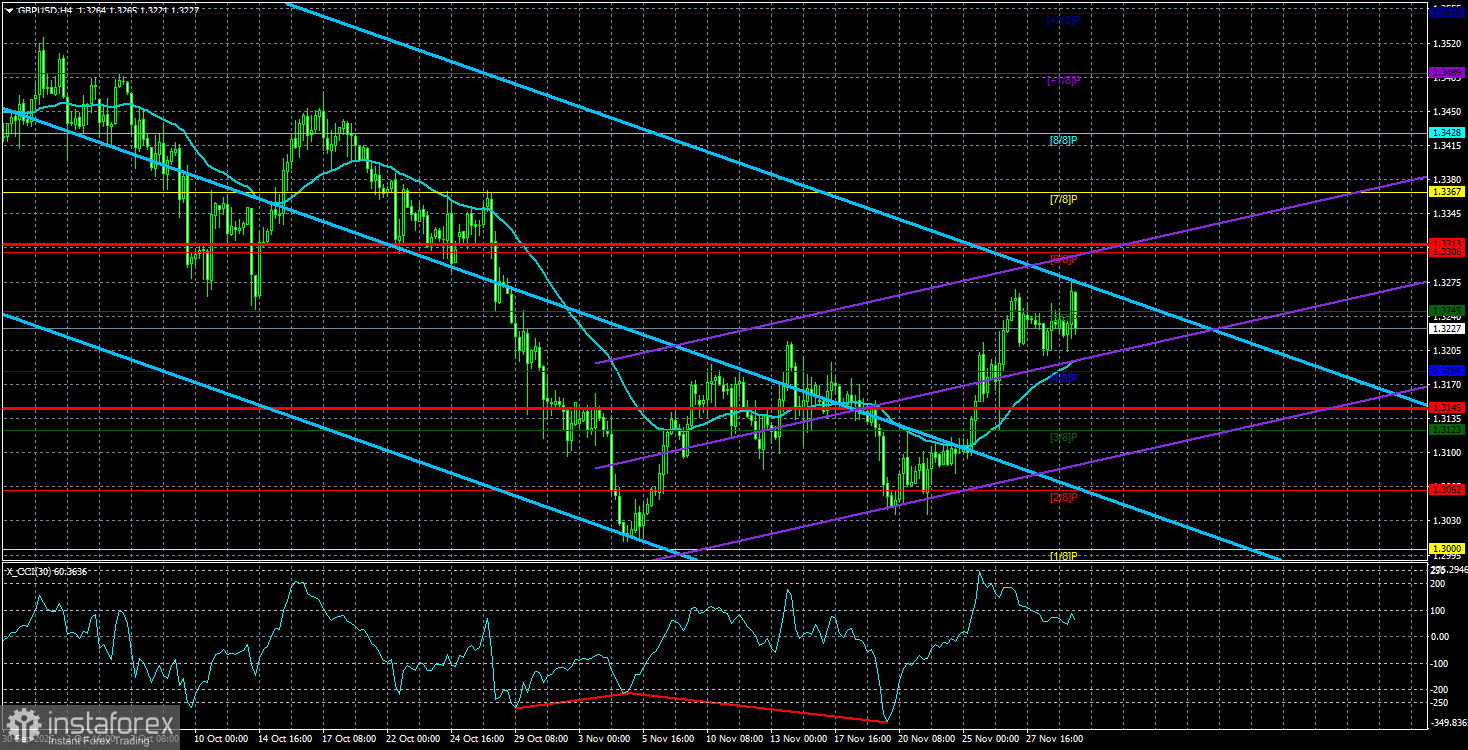
The average volatility of the GBP/USD pair over the last five trading days is 84 pips, which is considered "average" for this pair. On December 2, we expect movement within the range bounded by levels 1.3145 and 1.3313. The upper channel of the linear regression is directed downward, but this is only due to technical correction on higher timeframes. The CCI indicator has entered the oversold area 6 times in recent months and has formed another "bullish" divergence, consistently signaling a potential resumption of the upward trend.
Nearest Support Levels:
- S1 – 1.3184
- S2 – 1.3123
- S3 – 1.3062
Nearest Resistance Levels:
- R1 – 1.3245
- R2 – 1.3306
- R3 – 1.3367
Trading Recommendations:
The GBP/USD currency pair is attempting to resume the upward trend of 2025, and its long-term prospects remain unchanged. Donald Trump's policies will continue to exert pressure on the dollar, so we do not expect the U.S. currency to appreciate. Thus, long positions with targets of 1.3306 and 1.3428 remain relevant for the near term while the price is above the moving average. If the price is below the moving average line, small short positions with a target at 1.3062 can be considered on technical grounds. Occasionally, the American currency shows corrections (in a global context), but for a strong trend, it needs signs of an end to the trade war or other global positive factors.
Illustration Explanations:
- Linear Regression Channels: Help determine the current trend. If both are directed in the same way, it indicates a strong trend.
- Moving Average (settings 20,0, smoothed): Defines the short-term trend and the direction for current trades.
- Murray Levels: Target levels for movements and corrections.
- Volatility Levels (red lines): The probable price channel in which the pair will spend the next 24 hours based on current volatility metrics.
- CCI Indicator: Its entry into the oversold area (below -250) or the overbought area (above +250) indicates that a trend reversal in the opposite direction is approaching.


