


Trend Analysis (Fig. 1).
On Wednesday, the market may continue moving upward from the 1.3207 level (yesterday's daily candle close) toward the target of 1.3282 — the 38.2% pullback level (blue dotted line). When testing this level, the price may pull back downward toward the target of 1.3274 — the upper fractal (daily candle of December 1, 2025).
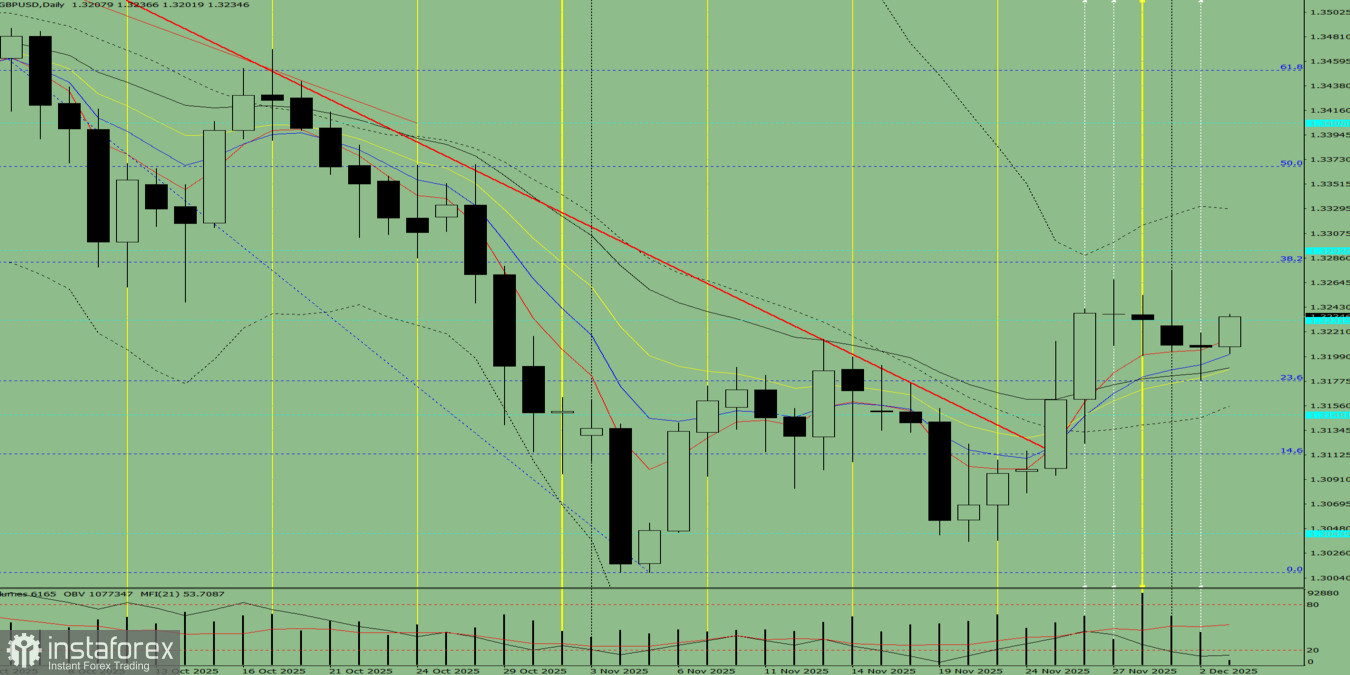
Fig. 1 (daily chart).
Comprehensive Analysis:
- Indicator analysis – upward
- Fibonacci levels – upward
- Volumes – upward
- Candlestick analysis – upward
- Trend analysis – upward
- Bollinger Bands – upward
- Weekly chart – upward
Overall conclusion: upward trend.
Alternative scenario: On Wednesday, the market may continue moving upward from the 1.3207 level (yesterday's daily candle close) toward the target of 1.3293 — a historical resistance level (light blue dotted line). When testing this level, the price may pull back downward toward the target of 1.3282 — the 38.2% pullback level (blue dotted line).


